|
6.
What is a pyramid of biomass? How do you construct pyramids of biomass - examples explained,
AND why is biomass lost
along a food chain?
[Author
©
Dr WP Brown PhD:
Doc Brown's biology exam revision notes suitable for students of UK
IGCSE & GCSE level biology courses & ~ US grades 9-10 biology,
page updated Feb 6th 2026 *]
[Key
points and learning objectives for this page, after the main body of
notes]
Sub-index
of Biomass, energy. pyramids, food web notes
[email doc b]
*
[privacy-policies-disclaimer] *
]SEARCH doc b's
science website]
(6a)
Pyramids of biomass, how to construct them, examples explained, why
is biomass lost?
Biomass is mainly organic matter, derived
from recently living organisms, and the source chemical energy
production for life. Examples include crops, agricultural residues,
sewage waste, but the largest biomass residues are from wood. It
is specified for a given population of a trophic level in a food
chain.
The term biomass refers to the
amount of living material you are dealing with e.g. in a trophic
level.
Its worth bearing in mind that
only ~1% of sunlight energy ends up as plant biomass!
The mass of living material
(the biomass) at each stage in a food chain (trophic level) is always less than
that of the previous
stage.
The amount of biomass transferred
from one trophic level to the next higher trophic level is only ~10%.
I've done some calculations
in part 6 to see how biomass transfer works out
quantitatively.
The biomass at each stage can be drawn to scale and shown as a
pyramid of biomass.
Level 1 is always at the bottom of
the pyramid, followed by the other successive trophic levels.
Pyramids of biomass only use the dry
mass because wet mass can vary so much in water content.
Examples
of food chains and biomasses
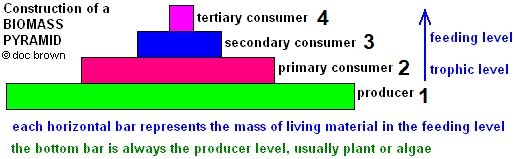
Each bar on a biomass pyramid represents the relative
amount of mass for the organisms of that trophic level in a food chain
and because of natural losses (including energy molecules), it
always decreases up the pyramid (take care - this is not always so
for a pyramid of numbers).
Up the food chain:
producer (1) ==>
primary consumer (2) ==> secondary consumer (3) ==> tertiary consumer
(4)
(trophic level)
The
producer is usually a photosynthesising plant or algae.
How to construct a biomass
pyramid - quantitatively
to scale on graph paper:
To draw to scale, you must keep
the vertical height the same for each level and make the horizontal length
of the bar proportional to the biomass of that trophic level in the pyramid.
In a biomass pyramid, each
horizontal bar (drawn to scale) is proportional to the
relative mass of the living
material at that producing level and feeding levels (trophic levels).
Obviously, the bigger the bar,
the greater the biomass at the producer/feeding-trophic level.

Above is a biomass pyramid drawn
to scale on the graph paper for the food chain:
2000 g of pondweed (plant
producer, trophic level 1)
==> 200 g insects
(herbivore, primary consumer, trophic level 2)
==> 80 g frogs
(carnivore, secondary consumer, trophic level 3)
==> 40 g of bass
fish (carnivore, tertiary consumer, trophic level 4)
(Note the vertical height of
each bar is the same (1 cm) and the horizontal length is
proportional to the biomass of that trophic level)
Why is the biomass diagram a
'pyramid'?
Up the food chain, up the
trophic levels and 'up the
pyramid', the biomass gets less because of loss of organic material e.g. not
digested, excreted waste.
Also, the energy from respiration,
although required to sustain life,
eventually becomes waste heat energy to the surroundings and waste products
of water and particularly carbon dioxide - most biomass in based
on carbon compounds like sugars, fats and proteins..
Loss of biomass
The
amounts of material and energy
contained in the biomass of organisms are
reduced at each successive stage (each trophic level) in a food chain because:
So, why the reduction trend
in biomass?
(i)
Organisms don't eat
everything they consume
Some materials (biomass) and energy are always
lost in the organisms’ waste materials
by e.g. animal excretion (urine, faeces-droppings), fallen leaves from trees etc.
This is often plant
material that cannot be digested by animals.
Herbivores need to
eat large quantities of plant material to obtain
sufficient amount of biomass for growth and energy.
In doing so they
produce large amounts of faeces containing the
indigestible plant material.
Carnivores,
including ourselves and most pet! eat less often because
meat and processed carbohydrates are easier to digest,
and produce less faeces, less biomass loss -
though this still contains indigestible material.
The word egestion
means getting rid of undigested waste food in an animals faeces
- not all food taken in can be digested and used by the
organism. This contributes to the wasted mass and energy n a
food chain.
Excretion means
getting rid of waste products through chemical reactions in the
body e.g. breathing out, sweating and urinating.
Urea, excreted
in urine, is a waste substance produced in the kidney as
a means of removing excess nitrogen from unused amino
acids from protein - further loss of biomass.
Also, some parts of plant
or animal material are inedible e.g. certain types
complex carbohydrates in plants like lignin or the bony parts of
animals - bone, horn, hooves or teeth.
Therefore, like the waste, these materials do not get passed up the food chain.
(ii)
Part of the biomass is
the chemical energy store of the organism
Respiration supplies all the energy needs for living processes, including
movement and much of this energy is eventually transferred to the surroundings,
particularly with warm blooded mammals where much energy is spent in
maintaining their raised body temperature.
In respiration, animals
use large amounts of glucose from digested food.
In the process of
respiration biomass is converted into other substances which
are also lost as waste, e.g. as in the chemistry of respiration.
The overall simplistic equation
for respiration (the opposite of photosynthesis)
glucose + oxygen ==> water +
carbon dioxide (waste + energy)
This energy is needed for
all life processes, energy to do things like movement of any
organism, heat to keep mammals and birds warm - which
ultimately means large amounts of energy are transferred to
the surroundings.
There is even waste, loss
of biomass, from the protein animals eat. Any excess
protein-amino acids is converted to urea and excreted in
urine.
Because of (i) and (ii) ...
A
pyramid of biomass will always be a pyramid shape - each
successive trophic level contains less mass of living material if
you could add up all the masses of the individuals in a population,
AND, it is rare for food
chains to have more than five trophic levels because so much biomass
is lost at each stage.
The able summarises the ideas
explained above
|
plant
producers |
sunlight
energy
=========>
photosynthesis |
food
overall biomass increase |
available food consumed
by animals
========= food
chain =========>
(i) digestion and (ii) respiration at
each stage |
|
BIOMASS LOSS |
plant
respiration ↓ |
overall ↓ biomass decrease |
|
H2O,
CO2 losses |
(i) undigested food
loss, (ii) H2O, CO2 losses |
Its worth pointing out that commercial food production is more efficient than the biomass
transfers in the food chains of naturally occurring ecosystems
because:
There are fewer stages, less
energy is lost,
and concentrated food sources
can be used to supplement natural sources
e.g. food supplements can be
fed to cattle as well as their natural grazing in fields of
grass.
The 'pros and cons' of pyramids
of biomass and pyramids of numbers data analysis
Pyramids of biomass are better at
showing the amount of energy in a trophic level than a
pyramid of numbers.
Although a simplification, you can think that usable
chemical potential energy is proportional to biomass.


Comparing a pyramid of numbers
(may/may not be a pyramid) with a pyramid of mass (always a
pyramid).
BUT ...
It is much easier to do the
counting of organisms to estimate their populations in a
habitat.
In order to gather biomass
data you must first collect and kill specimens to obtain their
dry mass.
It may be difficult to catch
and weigh the specimens in the first place - to avoid ethical
issues over catching and killing organisms, estimates of
biomass are often used.
The biomass of an organism
may vary - plants in winter may shed their leaves reducing their
biomass compared to summer.
Omnivores may feed at two
trophic levels, confusing the biomass data.
6b. More examples of food chains
expressed
as pyramids of biomass
Food chain and biomass
pyramid example 1

Butterflies/caterpillars feed
off cabbage ==> butterflies eaten by blue/great tit birds ==> bird of prey
eg kestrel, catches the smaller birds like blue/great tits

plants producers (100%) ==>
primary consumers (caterpillars/butterflies, 15%) ==> secondary consumers (small birds
2%) ==> bird of prey (0.15%)
The percentages in () represent
the biomass remaining based on the original 100% of cabbage plants.
It takes plenty of vegetables to
feed the local population of cabbage white butterflies, as gardeners know to
their cost!, and look how little is left to produce the biomass
of the kestrel.
Food chain and biomass
pyramid example 2

Pondweed eat by tadpoles ==>
eaten by water beetle ==> perch fish eat water beetle ==> otter eats
perch fish

It takes al lot of pondweed to
feed a batch of tadpoles.
Key points -
Summary of ideas
Based on
the syllabus-specifications for students taking the AQA, Edexcel and OCR
GCSE level biology examinations (~US grades 9-10).
A pyramid of
biomass is a diagram that represents the relative amount of
biological material (biomass) at each trophic level in a food chain.
It shows how biomass decreases as you move up the food chain because
energy is lost at each stage through processes like respiration,
movement, and waste production.
How to Construct
a Pyramid of Biomass
-
Identify the
Trophic Levels
-
The
producer (plants) is always at the bottom.
-
The
primary consumer (herbivores) comes next.
-
The
secondary consumer (carnivores that eat herbivores)
follows.
-
The
tertiary consumer (top predators) is at the top.
-
Measure
Biomass
-
Draw the
Pyramid
-
Each bar should be
proportional to the biomass at that level.
-
Bars must be
touching and centered around a
midpoint.
-
The pyramid should
always be pyramid-shaped, as biomass decreases
at higher levels.
For example, in a food
chain:
Grass → Grasshopper → Frog → Snake
The biomass of grass will be the largest, followed by grasshoppers, then
frogs, and finally snakes.
Summary of
learning objectives and key words or phrases
Know how to construct pyramid of
biomass for a food chain of plants and animals
Be able to explain why biomass is
lost at each stage in a food chain.
WHAT NEXT?
TOP OF PAGE
Index of Biomass,
energy. pyramids, food web notes
Big website and use [SEARCH
BOX] below, maybe quicker than the indexes
INDEX of all my BIOLOGY NOTES
HOME PAGE of Doc Brown's Science
website
UK KS3 Science Quizzes for
KS3 science students aged ~11-14, ~US grades 6, 7 and 8
Biology * Chemistry
* Physics UK
GCSE level students aged ~14-16, ~US grades 9-10
Advanced Level Chemistry
for pre-university age ~16-18 ~US grades 11-12, K12 Honors
Find your GCSE/IGCSE
science course for more help links to all science revision notes
email doc
brown - comments - query?
Explaining the importance of
understanding constructing pyramids of mass in a food chain
in GCSE level biology, What you need to know about understanding
constructing pyramids of mass in a food chain for
GCSE level
biology,
Explaining the use of understanding constructing pyramids of mass in a
food chain knowledge in GCSE level biology, Examples of understanding
constructing pyramids of mass in a food chain explained
when studying GCSE level biology, What is
the significance of understanding constructing pyramids of mass in a food
chain in GCSE level biology, describing and
explaining the theory of understanding constructing pyramids of mass in a
food chain when studying GCSE level biology, revision
notes for understanding constructing pyramids of mass in a food chain in exams, online help for understanding
constructing pyramids of mass in a food chain, exam revision
notes for understanding constructing pyramids of mass in a food chain, what do I need to learn about
understanding constructing pyramids of mass in a food chain? revision summary for
understanding constructing pyramids of mass in a food chain, learning notes for
understanding constructing pyramids of mass in a food chain, help to pass the
understanding constructing pyramids of mass in a food chain
topic in an exam question, how to prepare for questions on understanding
constructing pyramids of mass in a food chain in a GCSE
biology examination?
Based on the syllabus-specifications
for students taking the IGCSE/GCSE level biology examinations summary
revision notes and key points on understanding constructing pyramids of
mass in a food chain for students taking the AQA
igcse/gcse biology notes on understanding constructing pyramids of mass in a food
chain, Edexcel gcse
biology notes on understanding constructing pyramids of mass in a
food chain, OCR 21st century GCSE
biology notes on understanding constructing pyramids of mass in a
food chain, OCR gateway
GCSE biology notes on understanding constructing pyramids of mass in
a food chain, WJEC gcse biology notes on understanding constructing
pyramids of mass in a food chain, CCEA
gcse biology notes on understanding constructing pyramids of mass in a
food chain for students taking CIE Cambridge igcse
biology, or any other GCSE or IGCSE level biology exams notes on
understanding constructing pyramids of mass in a food chain, useful for US grade 9-10 biology courses,
Explaining the importance of explaining why
is biomass in a food chain
in GCSE level biology, What you need to know about explaining why is
biomass in a food chain for
GCSE level
biology,
Explaining the use of explaining why is biomass in a food chain knowledge in GCSE level biology, Examples of
explaining why is biomass in a food chain explained
when studying GCSE level biology, What is
the significance of explaining why is biomass in a food chain in GCSE level biology, describing and
explaining the theory of explaining why is biomass in a food chain when studying GCSE level biology, revision
notes for explaining why is biomass in a food chain in exams, online help for understanding
explaining why is biomass in a food chain, exam revision
notes for explaining why is biomass in a food chain, what do I need to learn about
explaining why is biomass in a food chain? revision summary for
explaining why is biomass in a food chain, learning notes for explaining
why is biomass in a food chain, help to pass the explaining why is
biomass in a food chain
topic in an exam question, how to prepare for questions on explaining
why is biomass in a food chain in a GCSE
biology examination?
Doc Brown's school biology revision notes: GCSE biology, IGCSE
biology, O level biology, ~US biology science grade 8, grade 9 and
grade 10 school science courses or equivalent for ~14-16 year old students of
biology IGCSE AQA GCSE Biology Edexcel GCSE Biology IGCSE OCR Gateway Science
Biology OCR 21st Century Science Biology Some of these biology revision notes
might be suitable for UK KS3 Science-Biology courses for ages 12-14 (~US biology
science grades 6, grade 7 and
grade 8)
SITEMAP Website content © Dr
Phil Brown 2000+. All copyrights reserved on biology revision notes, images,
quizzes, worksheets etc. Copying of website material is NOT
permitted. Exam revision summaries and references to science course specifications
are unofficial.
|
