|
GCSE level physics exam revision notes Forces and Motion 1.3 Drawing and interpreting distance - time graphs, interpretation and calculations - graphical problem solving [Author © Dr Phil Brown PhD: Doc Brown's physics exam revision notes suitable for students of UK IGCSE & GCSE level physics courses, ~ US grades 9-10 physics [updated Mar 18th 2026 *][ KEY POINTS and learning objectives for this page, after initial notes]email doc brown: problems?, comments? query? * [privacy & cookies policies & disclaimer] INDEX for physics notes on speed calculations and constructing and interpreting distance-time graphs This page contains online questions only. Jot down your answers, check against the worked out answers at the end of the page 1.3 Drawing and interpreting distance - time graphs and calculations - problem solving
Examples of distance-time graph calculation questions
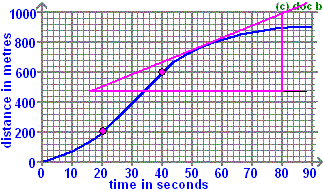
Questions based on distance-time graphs Q2.1 The graph below shows part of a car journey.
Distance - time graph for a short car journey Interpretation question using speed = distance / time (a) Including calculating the average speed, describe and explain the motion of the car between:
(b) What is the average speed of the car while it is moving?
(c) How can you find the specific speed of the car at any point on the graph?
(d) What is the speed of car at 56 seconds?
Q2.2 The graph below summarises part of the journey of a train (somewhat delayed at some point!).
Interpretation question using speed = distance / time and giving your answers in km/hour and m/s (a) What is the average speed between 1300 and 1400 hours? (b) What is the average speed between 1530 and 1800 hours? (c) How long was the train stopped for? (d) What was the average speed for the whole journey? Worked out ANSWERS to distance-time graph questions Velocity - Time graphs and acceleration are dealt with in detail in section 2 INDEX physics notes: Speed calculations and distance-time graphs about speed and velocity - interpreting distance-time graphs
A structured set of summary revision notes on interpreting distance-time graphs for moving objects, tailored to the GCSE/IGCSE physics specifications across major UK exam boards: WJEC, CCEA, CIE, AQA, Edexcel, and OCR. Interpreting Distance-Time GraphsWhat Is a Distance-Time Graph?
Key Graph Features
Calculating Speed from Graph
Worked ExampleA graph shows a straight line from 0 m to 100 m over 20 s.
Typical Exam Board Syllabus Content
Student Exam Tips
Relative motion in real life
Distance-Time Graphs in Real LifeFitness Trackers
Traffic Monitoring
Lift in a Building
Why It Matters
Keywords, phrases and learning objectives for speed, motion and graphs
WHAT NEXT? INDEX for physics notes on speed calculations and constructing and interpreting distance-time graphs INDEX of all my physics notes on FORCES and MOTION INDEX of all my physics notes on FORCES email doc brown - comments - query? BIG website, using the [SEARCH BOX] below, maybe quicker than navigating the many sub-indexes Basic Science Quizzes for UK KS3 science students aged ~12-14, ~US grades 6-8 Biology * Chemistry * Physics for UK GCSE level students aged ~14-16, ~US grades 9-10 Advanced Level Chemistry for pre-university age ~16-18 ~US grades 11-12, K12 Honors Find your GCSE/IGCSE science course for more help links to all science revision notes importance of drawing, interpreting distance-time graphs exam practice calculation questions in GCSE level physics, What you need to know about drawing, interpreting distance-time graphs exam practice calculation questions for GCSE level physics, Explaining the use of drawing, interpreting distance-time graphs exam practice calculation questions knowledge in GCSE level physics, Examples of drawing, interpreting distance-time graphs exam practice calculation questions explained when studying GCSE level physics, What is significant about drawing, interpreting distance-time graphs exam practice calculation questions, describing the theory of drawing, interpreting distance-time graphs exam practice calculation questions when studying GCSE level physics, revision notes for drawing, interpreting distance-time graphs exam practice calculation questions in exams, online exam help for drawing, interpreting distance-time graphs exam practice calculation questions, revision notes about drawing, interpreting distance-time graphs exam practice calculation questions, what do I need to learn about drawing, interpreting distance-time graphs exam practice calculation questions for by GCSE physics exam? help to understand the drawing, interpreting distance-time graphs exam practice calculation questions topic in preparation for GCSE physics exam question, how to prepare for questions involving drawing, interpreting distance-time graphs exam practice calculation questions in a GCSE physics examination? Revision notes on drawing, interpreting distance-time graphs exam practice calculation questions based on the syllabus-specifications for students taking IGCSE/GCSE level physics examinations, summary revision notes and key points on drawing, interpreting distance-time graphs exam practice calculation questions for students taking the AQA igcse/gcse physics notes on drawing, interpreting distance-time graphs exam practice calculation questions, Edexcel gcse physics notes on drawing, interpreting distance-time graphs exam practice calculation questions, OCR 21st century GCSE physics notes on drawing, interpreting distance-time graphs exam practice calculation questions, OCR gateway GCSE physics notes on drawing, interpreting distance-time graphs exam practice calculation questions, WJEC gcse physics notes on drawing, interpreting distance-time graphs exam practice calculation questions, CCEA gcse physics notes on drawing, interpreting distance-time graphs exam practice calculation questions for students taking CIE Cambridge igcse physics, exam revision notes on drawing, interpreting distance-time graphs exam practice calculation questions, useful for US grade 9-10 physics courses SITEMAP Website content © Dr Phil Brown 2000+. All copyrights reserved on Doc Brown's physics revision notes, images, quizzes, worksheets etc. Copying of website material is NOT permitted. Exam revision summaries and references to GCSE science course specifications are unofficial. INDEX physics notes: Speed calculations and distance-time graphs |
|||||||||||||||||||||
|
Worked out
ANSWERS
to the distance-time graph questions Q2.1 The graph below shows part of a car journey.
Distance - time graph for a short car journey Interpretation question using speed = distance / time (a) Including calculating the average speed, describe and explain the motion of the car between:
(b) What is the average speed of the car while it is moving?
(c) How can you find the specific speed of the car at any point on the graph?
(d) what is the speed of car at 56 seconds?
Q2.2 The graph below summarises part of the journey of a train (somewhat delayed at some point!).
Interpretation question using speed = distance / time and giving your answers in km/hour and m/s (a) What is the average speed between 1300 and 1400 hours?
(b) What is the average speed between 1530 and 1800 hours?
(c) How long was the train stopped for?
(d) What was the average speed for the whole journey?
INDEX physics notes: Speed calculations and distance-time graphs Website content © Dr Phil Brown 2000+. All copyrights reserved on Doc Brown's physics revision notes, images, quizzes, worksheets etc. Copying of website material is NOT permitted. Exam revision summaries and references to science course specifications are unofficial. Explaining the importance of distance-time graph calculations in GCSE physics, What you need to know about distance-time graph calculations for IGCSE physics, Explaining the use of distance-time graph calculations knowledge in GCSE physics, Examples of distance-time graph calculations explained for GCSE physics exams, What is the significance of distance-time graph calculations in studying for physics exams, What is the use of distance-time graph calculations ? Describing and explaining the theory of distance-time graph calculations, revision preparation for AQA GCSE physics, Edexcel GCSE physics, OCR GCSE physics. Website content © Dr Phil Brown 2000+. All copyrights reserved on Doc Brown's physics revision notes, images, quizzes, worksheets etc. Copying of website material is NOT permitted. Exam revision summaries and references to science course specifications are unofficial. These revision notes on distance-time graph calculations are suitable for AQA gcse physics, distance-time graph calculations revision notes for Edexcel gcse physics, distance-time graph calculations revision notes for OCR gcse Gateway science physics, distance-time graph calculations revision notes for OCR 21st Century science physics, distance-time graph calculations revision notes WJEC GCSE physics, distance-time graph calculations revision notes for CCEA gcse physics, distance-time graph calculations revision notes for CIE Cambridge IGCSE physics exams. distance-time graph calculations explained with examples, help in revising distance-time graph calculations for gcse physics exams, knowing the importance of distance-time graph calculations for gcse physics exams, key points to know about distance-time graph calculations, exam revision notes for distance-time graph calculations, what you need to know about distance-time graph calculations, revision help in learning about distance-time graph calculations |

 Graph
curves upwards, showing
increasing speed/velocity with time (acceleration), for each incremental time
unit (e.g. minute or second) there is an ever increasing (larger) distance
(∆d) covered in the same time (∆t).
Graph
curves upwards, showing
increasing speed/velocity with time (acceleration), for each incremental time
unit (e.g. minute or second) there is an ever increasing (larger) distance
(∆d) covered in the same time (∆t). Graph is
flat/horizontal, indicating
zero speed/velocity, there is no increase in distance with time, object has
stopped moving.
Graph is
flat/horizontal, indicating
zero speed/velocity, there is no increase in distance with time, object has
stopped moving. Graph
shows
the curve is levelling off, steadily decreasing speed/velocity with time (deceleration),
for each incremental time unit (e.g. minute or second) there is an ever
decreasing (smaller) distance covered in the same time.
Graph
shows
the curve is levelling off, steadily decreasing speed/velocity with time (deceleration),
for each incremental time unit (e.g. minute or second) there is an ever
decreasing (smaller) distance covered in the same time. Graph
is
linear, showing
constant speed/velocity, the distance covered in any equal time increment is the
same.
Graph
is
linear, showing
constant speed/velocity, the distance covered in any equal time increment is the
same.