|
GCSE level Physics exam revision notes on Forces & Motion Part 5 Part 5.5 Road safety - Graphical analysis of braking distances, relating speed and the kinetic energy of a moving road vehicle [Author © Dr Phil Brown PhD: Doc Brown's physics exam revision notes suitable for students of UK IGCSE & GCSE level physics courses, ~ US grades 9-10 physics [forces-motion-5- updated Mar 26th 2026][ KEY POINTS and learning objectives for this page, after initial notes]See parts 5.2, 5.6 and 5.8 via index link below email doc brown: comments? query? * [privacy & cookies policy & disclaimer] * [SEARCH] 5.5 Graphical analysis of braking distances, speed and kinetic energy of a moving road vehicle What is the relationship between braking distance and kinetic energy?
Graph 1a assumes a uniform decrease in velocity i.e. uniform deceleration See part 5.8 Some advanced calculations on braking force and removing vehicle kinetic energy
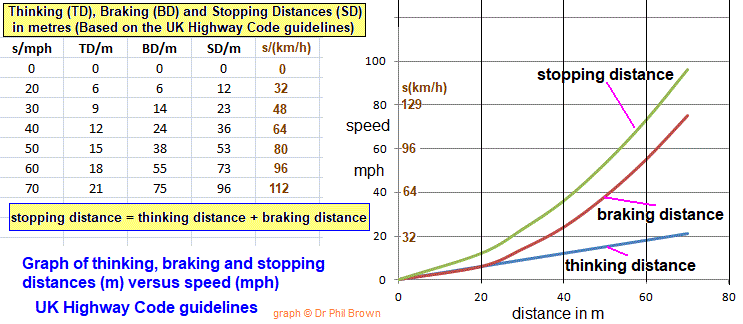
The graph 1b above takes the thinking distance, braking distance and stopping distance data and plots them against the typical speed of a road vehicle.
Key points force and motion: Road safety -
A clear breakdown of GCSE Physics data on stopping distances for road vehicles, including how thinking distance, braking distance, and stopping distance relate and vary with speed: Definitions
Typical Data Table (Dry Conditions)
Note: Thinking distance increases linearly with speed, while braking distance increases quadratically (due to kinetic energy being proportional to v2 . Reminders of Factors Affecting Distances
Keywords, phrases and learning objectives for the physics of road vehicles - braking distance graphs and calculations
WHAT NEXT? INDEX of all my physics notes on FORCES and MOTION INDEX of all my physics notes on FORCES email doc brown - comments - query? BIG website, using the [SEARCH BOX] below, maybe quicker than navigating the many sub-indexes HOME PAGE of Doc Brown's Science Basic Science Quizzes for UK KS3 science students aged ~12-14, ~US grades 6-8 Biology * Chemistry * Physics for UK GCSE level students aged ~14-16, ~US grades 9-10 Advanced Level Chemistry for pre-university age ~16-18 ~US grades 11-12, K12 Honors Find your GCSE/IGCSE science course for more help links to all science revision notes importance of road safety graph of braking distance, relating speed & kinetic energy of vehicle in GCSE level physics, What you need to know about road safety graph of braking distance, relating speed & kinetic energy of vehicle for GCSE level physics, Explaining the use of road safety graph of braking distance, relating speed & kinetic energy of vehicle knowledge in GCSE level physics, Examples of road safety graph of braking distance, relating speed & kinetic energy of vehicle explained when studying GCSE level physics, What is significant about road safety graph of braking distance, relating speed & kinetic energy of vehicle, describing the theory of road safety graph of braking distance, relating speed & kinetic energy of vehicle when studying GCSE level physics, revision notes for road safety graph of braking distance, relating speed & kinetic energy of vehicle in exams, online exam help for road safety graph of braking distance, relating speed & kinetic energy of vehicle, revision notes about road safety graph of braking distance, relating speed & kinetic energy of vehicle, what do I need to learn about road safety graph of braking distance, relating speed & kinetic energy of vehicle for by GCSE physics exam? help to understand the road safety graph of braking distance, relating speed & kinetic energy of vehicle topic in preparation for GCSE physics exam question, how to prepare for questions involving road safety graph of braking distance, relating speed & kinetic energy of vehicle in a GCSE physics examination? Revision notes on road safety graph of braking distance, relating speed & kinetic energy of vehicle based on the syllabus-specifications for students taking IGCSE/GCSE level physics examinations, summary revision notes and key points on road safety graph of braking distance, relating speed & kinetic energy of vehicle for students taking the AQA igcse/gcse physics notes on road safety graph of braking distance, relating speed & kinetic energy of vehicle, Edexcel gcse physics notes on road safety graph of braking distance, relating speed & kinetic energy of vehicle, OCR 21st century GCSE physics notes on road safety graph of braking distance, relating speed & kinetic energy of vehicle, OCR gateway GCSE physics notes on road safety graph of braking distance, relating speed & kinetic energy of vehicle, WJEC gcse physics notes on road safety graph of braking distance, relating speed & kinetic energy of vehicle, CCEA gcse physics notes on road safety graph of braking distance, relating speed & kinetic energy of vehicle for students taking CIE Cambridge igcse physics, exam revision notes on road safety graph of braking distance, relating speed & kinetic energy of vehicle, useful for US grade 9-10 physics courses SITEMAP Website content © Dr Phil Brown 2000+. All copyrights reserved on Doc Brown's physics revision notes, images, quizzes, worksheets etc. Copying of website material is NOT permitted. Exam revision summaries and references to GCSE science course specifications are unofficial. |

 v2
v2
