|
Interpreting the infrared
spectrum of 2-methylbut-1-ene
[Author
©
Dr
Phil Brown PhD:
Doc Brown's advanced level organic chemistry exam revision notes
suitable for students of UK A level chemistry courses & US K12 grade
11, grade 12 and AP honors chemistry courses: Molecular
spectroscopy - analysing the
infrared spectrum of
2-methylbut-1-ene
[spectra
page updated
Mar 13th 2026 *]
*
email doc
brown *
[privacy,
cookies & disclaimer policies] * Re-edit
infrared spectrum of
CH3CH2C(CH3)=CH2
Links associated
with 2-methylbut-1-ene
The
chemistry of alkenes
This is a BIG
chemistry website, please take time to explore it
Infrared spectroscopy - spectra index
Introductory note on the infrared spectrum of 2-methylbut-1-ene
(2-methyl-1-butene)
Students and teachers please note
my explanation of the infrared
spectrum of 2-methylbut-1-ene is designed
for advanced, but pre-university, chemistry courses.
Based in
the infrared spectrum diagram for 2-methylbut-1-ene, only some of the most
prominent peaks for particular bond vibrations are discussed,
particularly if 2-methylbut-1-ene has a functional group with a particular
characteristic wavenumber peak.
The infrared spectrum of
2-methylbut-1-ene is
unique and the whole, or selected wavenumbers, can be used to
fingerprint its identity, sometimes analysing a mixture
containing 2-methylbut-1-ene or following its change of concentration in a
reaction.

Spectra obtained from a liquid film of 2-methylbut-1-ene. The right-hand part of the of the
infrared spectrum of 2-methylbut-1-ene, wavenumbers
~1500 to 400
cm-1 is considered the fingerprint region for the
identification of 2-methylbut-1-ene and most organic compounds. It is due to a unique set
of complex overlapping vibrations of the atoms of the molecule of
2-methylbut-1-ene.
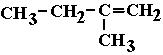
2-methylbut-1-ene C5H10,
 , ,

The molecular structure and naming of alkenes
Interpretation of
the infrared spectrum of 2-methylbut-1-ene
The most prominent infrared absorption lines of
2-methylbut-1-ene
The most characteristic absorption is ~1660 cm-1
due to the C=C vibration (stretching).
You don't find this C=C absorption band in the
infrared spectra of saturated alkanes.
There are also characteristic lines due to various
C-H vibration absorptions group at wavenumbers ~3100, ~2900,
~1290-1420 and ~900 cm-1.
The absence of other specific functional group bands
will show that particular functional group is absent from the
2-methylbut-1-ene
molecular
structure.
Summary of key points for the infrared spectrum of 2-methylbut-1-ene plus
extra exam revision comments
The infrared (IR) spectrum of
2-methylbut-1-ene into a structured, exam-focused format tailored
for advanced A-level Chemistry. This includes key absorptions,
misconceptions, and revision strategies across major exam boards.
Overview of
2-Methylbut-1-ene
- Structure:
CH2=C(CH3)CH2CH3
- Functional groups:
Terminal alkene (C=C), alkyl chains (C–H), methyl group
Prominent
Absorptions in the infrared spectrum of 2-methylbut-1-ene
| Bond Type |
Wavenumber
Range (cm⁻¹) |
Expected Peak
Characteristics |
Notes |
| C=C stretch (alkene) |
1620–1680 |
Medium, sharp |
Indicates presence of
double bond |
| =C–H stretch |
~3080 |
Weak to medium |
Unsaturated C–H (above
3000 cm⁻¹) |
| –CH2 / –CH3 stretch |
2850–2960 |
Strong, sharp |
Saturated C–H (below 3000
cm⁻¹) |
| =C–H bend (out-of-plane) |
910–990 |
Medium, sharp |
Diagnostic for terminal
alkenes |
| C–C / C–H bends |
1350–1470 |
Multiple overlapping
peaks |
Common in hydrocarbons |
| Fingerprint region |
1500–400 |
Complex, unique |
Used for compound
identification |
Common
Misconceptions about
the infrared spectrum of 2-methylbut-1-ene
(see also below)
- Misidentifying C=C as C=O:
C=O peaks are stronger and sharper (~1700 cm⁻¹); C=C is weaker and slightly
lower.
- Ignoring =C–H stretch:
Often overlooked due to its weak intensity, but crucial for confirming
unsaturation.
- Confusing fingerprint region:
Students may try to assign every peak—focus only on functional group region
(>1500 cm⁻¹) unless comparing known spectra.
- Assuming all broad peaks are O–H:
Hydrocarbons typically lack broad absorptions unless contaminated.
Exam Revision Tips
for questions involving
the infrared spectrum of 2-methylbut-1-ene
(AQA, Edexcel,
OCR, WJEC, CCEA, CIE, IB)
(see also above)
Functional Group Identification
- Focus on C=C stretch and
terminal =C–H bend to confirm alkene presence.
- Use C–H stretch region to
distinguish saturated vs unsaturated bonds.
Fingerprint Region Strategy
- Don’t interpret it peak-by-peak.
- Use it to compare spectra
for purity or isomer identification (e.g. 2-methylbut-1-ene vs
2-methylbut-2-ene).
Data Sheet Familiarity
- Know the standard ranges
from your board’s data booklet.
- Practice annotating spectra
with bond types and ranges.
Integration with Other Techniques
- Combine IR with mass spectrometry
or NMR for full structural analysis.
- IR confirms functional groups,
not full structure.
Past Paper Practice
- Look for questions asking:
- “What functional groups are present?”
- “How does the spectrum confirm the
identity?”
- “Compare spectra of isomers or
reaction products.”
Bonus Tip: Isomer Differentiation
- 2-methylbut-1-ene
shows a terminal alkene → expect 910–990 cm⁻¹
out-of-plane bend.
- 2-methylbut-2-ene
lacks this → useful for distinguishing in exam questions.
Key words & phrases: 2-methyl-1-butene
image and diagram explaining the infrared spectrum
of 2-methylbut-1-ene, complete infrared absorption spectrum of 2-methylbut-1-ene, comparative spectra of
2-methylbut-1-ene, prominent peaks/troughs for identifying functional groups in the infrared spectrum of
2-methylbut-1-ene,
important wavenumber values in cm-1 for peaks/troughs in the infrared spectrum
of 2-methylbut-1-ene, revision of infrared spectroscopy of 2-methylbut-1-ene, fingerprint region analysis of
2-methylbut-1-ene, how to identify 2-methylbut-1-ene from its infrared spectrum, identifying organic
compounds like 2-methylbut-1-ene from their infrared spectrum,
how to analyse the absorption bands in the infrared spectrum of
2-methylbut-1-ene detection of
alkene functional groups in the 2-methylbut-1-ene molecule example of the infrared spectrum of a
molecule like 2-methylbut-1-ene with an alkene functional group ?interpreting interpretation of the infrared spectrum of 2-methylbut-1-ene
2-methyl-1-butene How do you interpret the infrared absorption spectrum of
2-methylbut-1-ene (2-methyl-1-butene) How
to interpret the infrared spectrum of 2-methylbut-1-ene
(2-methyl-1-butene) Explanatory diagram of the infrared spectrum of the
2-methylbut-1-ene (2-methyl-1-butene) molecule
in terms of its molecular structure.
Listing data of the prominent main wavenumber peaks troughs in the infrared
spectrum of 2-methylbut-1-ene (2-methyl-1-butene). How to explain the infrared spectrum of
2-methylbut-1-ene (2-methyl-1-butene). Use of
the infrared spectrum of 2-methylbut-1-ene (2-methyl-1-butene), identification of
2-methylbut-1-ene (2-methyl-1-butene) from its
infrared spectrum - fingerprint wavenumber pattern to identify the
2-methylbut-1-ene (2-methyl-1-butene)
molecule. The uses of the infrared spectrum of the 2-methylbut-1-ene
(2-methyl-1-butene) molecule. The
distinctive features of the infrared spectrum of the
2-methylbut-1-ene (2-methyl-1-butene) molecule
explained. explaining the peaks-trough of the transmittance of the infrared
spectrum of 2-methylbut-1-ene (2-methyl-1-butene) what does the infrared spectrum tell you about the
structure and properties of the 2-methylbut-1-ene
(2-methyl-1-butene) molecule? How is infrared spectrum of 2-methylbut-1-ene
(2-methyl-1-butene) used to identify 2-methylbut-1-ene (2-methyl-1-butene)?
Links associated with 2-methylbut-1-ene
The mass spectrum of 2-methylbut-1ene
The H-1 NMR spectrum of
2-methylbut-1ene
The C-13 NMR spectrum of
2-methylbut-1ene
The chemistry of ALKENES
revision notes INDEX
Infrared spectroscopy index
ALL SPECTROSCOPY INDEXES
All Advanced Organic
Chemistry Notes
Use My Google search site box
Email doc b:
chem55555@hotmail.com
|
