|
(1) The periodicity of the 1st Ionisation enthalpy
from elements Z = 1 to 96
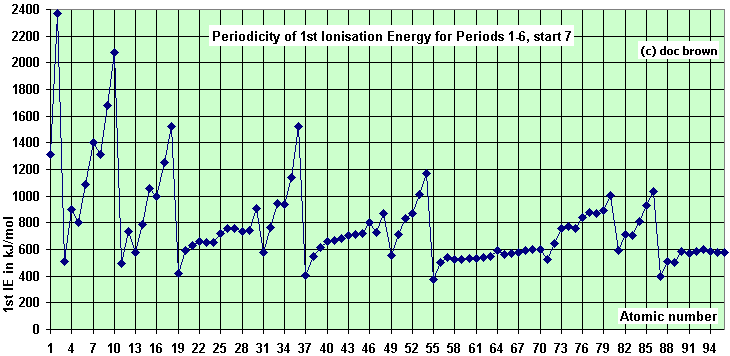
The peaks correspond with the Noble
Gases at the end of a period and the troughs with the Group 1 Alkali Metals
at the start of a period.
There is a general
increase in 1st ionisation energy from left to right across
a period.
As you go across the
period from one element to the next, the positive nuclear charge is
increasing by one unit as the atomic/proton number increases by one unit and
the charge is acting on electrons in the same principal quantum level.
The effective nuclear charge
is
approximately the number of outer electrons and this is increasing from left to
right as no new quantum shell is added
i.e. no extra shielding.
Therefore the outer electron is increasingly more strongly held by the nucleus and so,
increasingly, more energy is needed remove it.
For the d blocks
and f blocks, the increase is often more gradual as the sub–shells
are filled with electrons of similar energy, though there are a few
sub–troughs.
For more details
for Periods 2 to 4 see Survey of Period 2 elements Z = 3
to 10,
Survey of Period 3
elements Z = 11 to 18
and
Survey of Period 4 elements Z = 19 to 36.
(2) The periodicity of atomic radius
from elements Z = 1 to 96
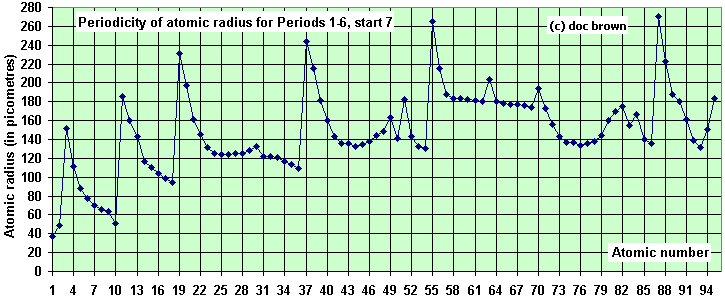
The peaks correspond with the Group 1
Alkali Metals at the start of a period and the troughs with the
Group 7 Halogens/Group 0 Noble Gases
(data uncertain for Group 0)
at the end of a period.
There is a general
decrease in atomic radius from left to right across a
period.
The
atomic radius generally decreases from left to right across a period, as the
actual and effective nuclear charge increases within the same
principal quantum level with increase in proton number.
This effect pulls the
electron cloud closer to the nucleus without any increase in
shielding. The argument is almost identical to that for increasing
ionisation energy.
For the d blocks and f blocks, the decrease is
often more gradual as the sub–shells are filled with electrons of
similar energy, though there are a few sub–peaks.
For more details
for Periods 2 to 4 see Survey of Period 2 elements Z = 3
to 10,
Survey of Period 3
elements Z = 11 to 18
and
Survey of Period 4 elements Z = 19 to 36.
(3)
The periodicity of electronegativity
from elements Z = 1 to 96
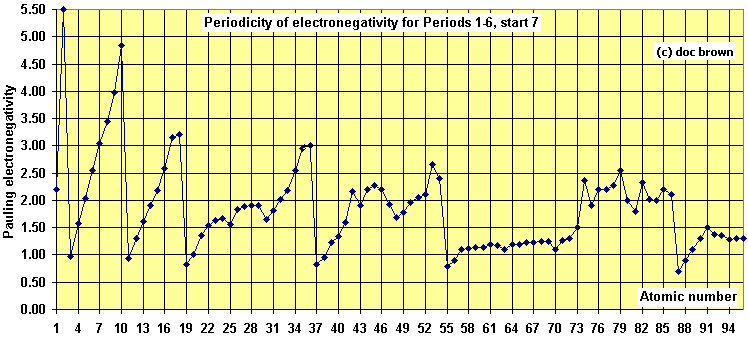
The peaks correspond to the Group 7
Halogens/Group 0 Noble Gases at the end of a period and the troughs' correspond to the most electropositive Group 1 Alkali Metals
at the start of a period.
There is a general
increase in electronegativity from left to right across a
period.
The
electronegativity
generally increases from left to right across a period, as the
actual and effective nuclear charge increases within the same
principal quantum level, pulling the electron cloud closer to the
nucleus (see 1st IE arguments)
i.e. increase in proton charge
without increase in shielding.
For the d blocks and f blocks, the
increase is often more gradual as the sub–shells are filled with
electrons of similar energy, though there are a few sub–troughs.
For more details
for Periods 2 to 4 see Survey of Period 2 elements Z = 3
to 10,
Survey of Period 3
elements Z = 11 to 18
and
Survey of Period 4 elements Z = 19 to 36.
(4) The periodicity
of melting points and
boiling points from
elements Z = 1 to 96
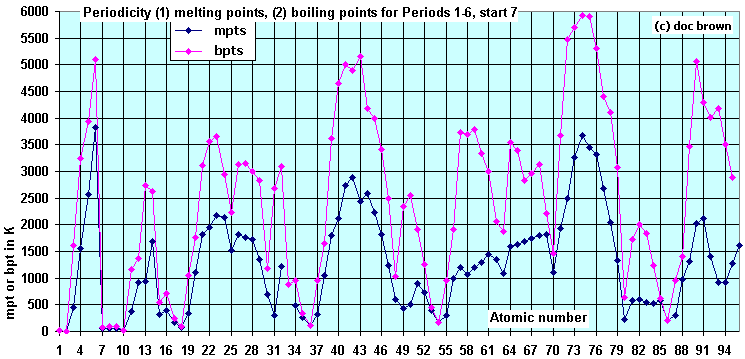
The melting points
and boiling points tend to peak in the middle of Periods 2 and
3 (Groups 3/13 and 4/14) and the lowest values at the end of the
period – the Noble Gases.
The highest values correspond to giant covalent or metallic lattice
structures.
Generally you are
moving from a low melting, but still quite high boiling, metallic lattice
of the Alkali Metals of moderately
strong bonding with one outer delocalised valence electron ==>
a much higher
melting and boiling metallic or giant covalent lattice with 2–4 outer electrons for
Groups 2 to 4/14 involved in bonding.
Most elements in the d and f
blocks have relatively high melting points and boiling points with
more d and f delocalised electrons contributing to the metallic
bonding in the lattice.
After the d and f blocks, in Groups3/13 to
Group 0/18, apart from a few semi–metals/metals you mainly have simple
molecular species only held together by weak intermolecular forces.
For more details
for Periods 2 to 4 see Survey of Period 2 elements Z = 3
to 10,
Survey of Period 3
elements Z = 11 to 18
and
Survey of Period 4 elements Z = 19 to 36.
(5) The periodicity
of relative electrical
conductivity from
elements Z = 1 to 96
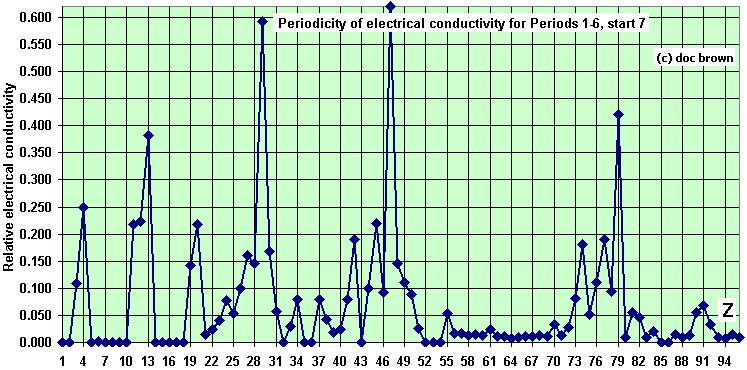
The peaks
correspond to the metals in the middle of the period with the
greatest number of outer electrons that can be delocalised.
Electrical conductivity increases dramatically from left to right for Groups 1–2 (and Al in
Group 3/13 in Period 3) as the metallic lattice contains 1–2–3 mobile
delocalised electrons involved in electrical conduction.
From Group
4 to 0 the element structure changes to giant covalent lattice,
semi–metal or simple molecular structures with less tendency towards
delocalisation or no free delocalised electrons at all, within the
structure to convey an electric current.
All the elements in the d
and f blocks have a fairly high electrical
conductivity due to the extra delocalisation of the d and f electrons contributing to the electrical conduction
in their metallic lattices.
For more details
for Periods 2 to 4 see Survey of Period 2 elements Z = 3
to 10,
Survey of Period 3
elements Z = 11 to 18
and
Survey of Period 4 elements Z = 19 to 36.
(6) The periodicity
of density from elements Z = 1 to 96
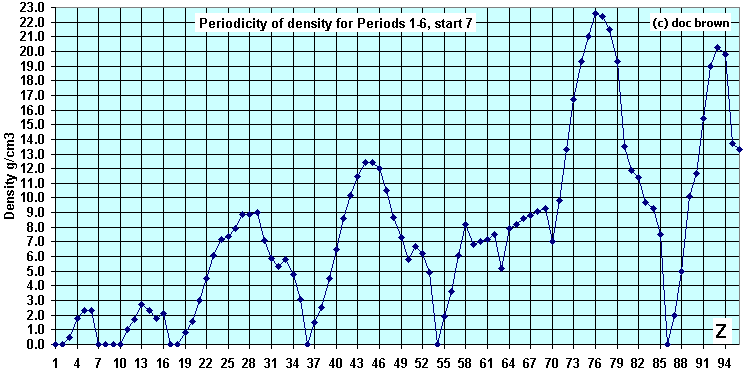
The peaks
correspond to the metals in the middle of the period with the
strongest bonding in the solid.
The density increases from lithium to beryllium as the atomic radii
decrease and the bonding gets stronger with 1 ==> 2 bonding
electrons (delocalised outer valency electrons in the metal
lattice).
Boron and silicon have a lower density, typical of
non–metallic covalent solids. Nitrogen, oxygen, fluorine and neon
are small covalent molecules and have very low densities being
gaseous at room temperature because only weak intermolecular forces
act between them.
All the elements in the d and f blocks have a fairly high
densities due to the extra delocalisation of the d and f electrons contributing
to stronger bonding and lower atomic radii in their metallic
lattices and the effect tends to peak 2/3rds
the way along a block.
For more details
for Periods 2 to 4 see Survey of Period 2 elements Z = 3
to 10,
Survey of Period 3
elements Z = 11 to 18
and
Survey of Period 4 elements Z = 19 to 36.
(7) The periodicity
of the molar volume from elements Z = 1 to 96
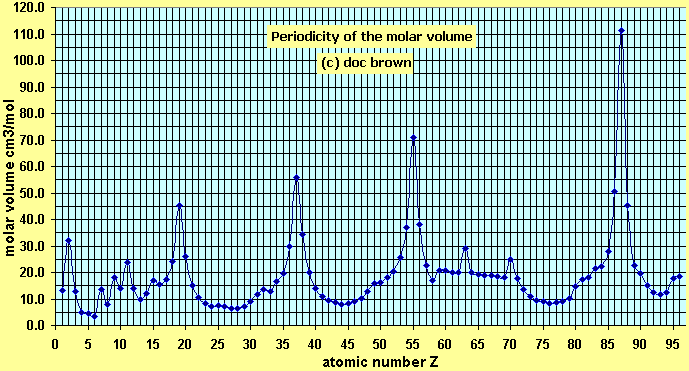
The peaks correspond with the least
dense solid/liquid elements, the Group 1 Alkali Metals and is a
historically important graph, first investigated by Lother Meyer in
1869 (see
History of Periodic Table
page).
The molar volume is the volume occupied by the relative
atomic mass of the element in grams.
For my graph I've used the
molar volume of the solid at room temperature and pressure (298K, 1
atm) or the volume of the liquified gas if the element is a gas at
room temperature.
It is one of the clearest graphs you can plot to
show the periodicity of an element's properties, but there are still
'inconsistencies' due to the complex behaviour of the
orbital energy levels.
WHAT NEXT?
Z = 1 to 20 periodicity plots *
Z = 1 to 38 periodicity plots *
DATA
[SEARCH
BOX]
|
Website content © Dr Phil Brown
2000+. All copyrights reserved on revision notes, images, quizzes,
worksheets etc. Copying of website material is NOT permitted. Doc
Brown's Chemistry notes on periodic trends and patterns,
Website content © Dr Phil Brown 2000+. All
copyrights reserved on revision notes, images, quizzes, worksheets etc. Copying
of website material is NOT permitted. Exam revision summaries & references to
A level chemistry course specifications are unofficial.
Website content © Dr Phil Brown 2000+. All
copyrights reserved on these inorganic chemistry exam revision
notes on For elements Z = 1 to 96 graphs of periodic trends in 1st ionisation
energy, atomic radius & electronegativity are described & explained, these A level chemistry revision notes are suitable for use of pre-university students studying AQA advanced level
inorganic chemistry revision notes on For elements Z = 1 to 96
graphs of periodic trends in melting/boiling points, electrical
conductivity & density - periodic trends are described & explained, Edexcel advanced level
inorganic chemistry revision notes on For elements Z = 1 to 96
graphs of periodic trends in 1st ionisation energy, atomic radius &
electronegativity are described & explained, OCR advanced level
inorganic chemistry revision notes on For elements Z = 1 to 96
graphs of periodic trends in melting/boiling points, electrical
conductivity & density - periodic trends are described & explained, IB advanced level
inorganic chemistry revision notes on For elements Z = 1 to 96
graphs of periodic trends in 1st ionisation energy, atomic radius &
electronegativity are described & explained, WJEC (Eduqas) advanced level
inorganic chemistry revision notes on For elements Z = 1 to 96
graphs of periodic trends in 1st ionisation energy, atomic radius &
electronegativity are described & explained, CIE Cambridge advanced level
inorganic chemistry revision notes on For elements Z = 1 to 96
graphs of periodic trends in melting/boiling points, electrical
conductivity & density - periodic trends are described & explained, CCEA advanced level
inorganic
chemistry revision notes on For elements Z = 1 to 96 graphs of periodic trends
in 1st ionisation energy, atomic radius & electronegativity are
described & explained, and useful for US grade 11 grade 12 AP honors
inorganic chemistry courses involving For elements Z = 1 to 96 graphs of
periodic trends in melting/boiling points, electrical conductivity &
density - periodic trends are described & explained
Explaining the importance of For elements Z = 1 to
96 graphs of periodic trends in 1st ionisation energy, atomic radius
& electronegativity are described & explained
in inorganic chemistry, What you need to know about
For elements Z = 1 to 96 graphs of periodic trends in
melting/boiling points, electrical conductivity & density - periodic
trends are described & explained for inorganic
chemistry,
Explaining the use of For elements Z = 1 to 96 graphs of periodic trends
in 1st ionisation energy, atomic radius & electronegativity are
described & explained knowledge in inorganic chemistry, Examples of
For elements Z = 1 to 96 graphs of periodic trends in
melting/boiling points, electrical conductivity & density - periodic
trends are described & explained when studying inorganic chemistry, What is
the significance of For elements Z = 1 to 96 graphs of periodic trends
in 1st ionisation energy, atomic radius & electronegativity are
described & explained in inorganic chemistry, What is the use of
For elements Z = 1 to 96 graphs of periodic trends in
melting/boiling points, electrical conductivity & density - periodic
trends are described & explained
in inorganic chemistry Describing and
explaining the theory of For elements Z = 1 to 96 graphs of periodic
trends in 1st ionisation energy, atomic radius & electronegativity
are described & explained when studying inorganic chemistry, exam revision
notes for
elements Z = 1 to 96 graphs of periodic trends in
melting/boiling points, electrical conductivity & density - periodic
trends are described & explained in exams, online help for
elements Z = 1 to 96 graphs of periodic trends in 1st ionisation
energy, atomic radius & electronegativity are described & explained, revision notes for
elements Z = 1 to 96 graphs of periodic trends in
melting/boiling points, electrical conductivity & density - periodic
trends are described & explained,
what do I need to learn for elements Z = 1 to 96 graphs of periodic
trends in 1st ionisation energy, atomic radius & electronegativity
are described & explained in exams? revision summary for
elements Z = 1 to 96 graphs of periodic trends in
melting/boiling points, electrical conductivity & density - periodic
trends are described & explained, help in
teaching For elements Z = 1 to 96 graphs of periodic trends in 1st
ionisation energy, atomic radius & electronegativity are described &
explained, learning notes for
elements Z = 1 to 96 graphs of periodic trends in
melting/boiling points, electrical conductivity & density - periodic
trends are described & explained, help to pass the
For elements Z = 1 to 96 graphs of periodic trends in 1st ionisation
energy, atomic radius & electronegativity are described & explained exam, how to
prepare for examination questions on
For elements Z = 1 to 96 graphs of periodic trends in
melting/boiling points, electrical conductivity & density - periodic
trends are described & explained? |
|
