Advanced Organic Chemistry: The infrared spectrum of ethanoic acid CH3COOH

HOME PAGE * SEARCH * GCSE Level Chemistry age ~14-16 * Advanced Level Chemistry age ~16-19

Interpreting and explaining the infrared spectrum of ethanoic acid (acetic acid) CH3COOH

[Author © Dr Phil Brown GRIC, PhD: Doc Brown's advanced level organic chemistry exam revision notes suitable for students of UK A level chemistry courses & US K12 grade 11, grade 12 and AP honors chemistry courses: Molecular spectroscopy analysis of ethanoic acid [spectra page updated RE-EDIT]

 email doc brown   Re-edit infrared spectrum of CH3COOH

 This is a BIG website, you need to take time to explore it

 Links associated with ethanoic acid  *  [privacy policy, cookies and disclaimer]

 Infrared spectroscopy - spectra index

See also comparing the infrared, mass, 1H and 13C NMR spectra of two isomers of C2H4O2

Exam practise questions based on the infrared spectrum of ethanoic acid


Introductory note on the infrared spectrum of ethanoic acid

Students and teachers please note my explanation of the infrared spectrum of ethanoic acid is designed for advanced, but pre-university, chemistry courses.

Based in the infrared spectrum diagram for ethanoic acid, only some of the most prominent peaks for particular bond vibrations are discussed, particularly if ethanoic acid has a functional group with a particular characteristic wavenumber peak.

The infrared spectrum of ethanoic acid is unique and the whole, or selected wavenumbers, can be used to fingerprint its identity, sometimes analysing a mixture containing ethanoic acid or following its change of concentration in a reaction.

infrared spectrum of ethanoic acid wavenumbers cm-1 functional group detection fingerprint pattern identification of ethanoic acid doc brown's advanced organic chemistry revision notes 

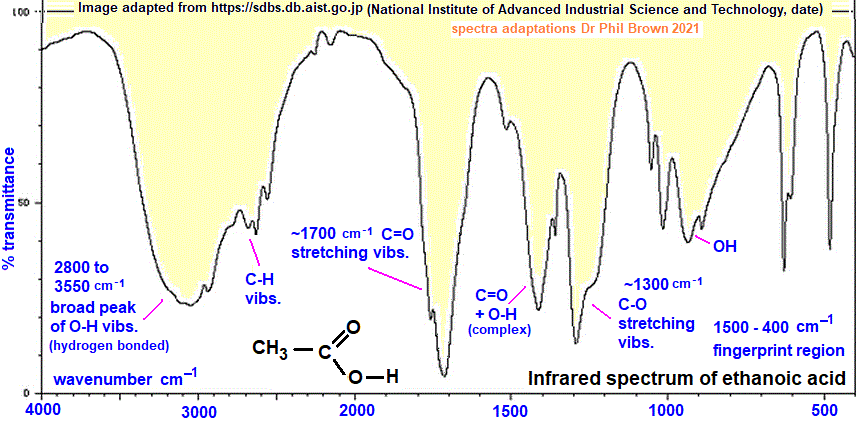
Spectra obtained from a liquid film of ethanoic acid. The right-hand part of the of the infrared spectrum of ethanoic acid, wavenumbers ~1500 to 400 cm-1 is considered the fingerprint region for the identification of ethanoic acid and most organic compounds. It is due to a unique set of complex overlapping vibrations of the atoms of the molecule of ethanoic acid.

Ethanoic acid, C2H4O2, (c) doc b , (c) doc b , (c) doc b , (c) doc b aliphatic carboxylic acid

For more see Structure and naming of CARBOXYLIC ACIDS and DERIVATIVES, including isomers

Interpretation of the infrared spectrum of ethanoic acid (an aliphatic carboxylic acid)

The most prominent infrared absorption lines of ethanoic acid

A very broad peak at wavenumbers 2800 to 3550 cm-1 for O-H stretching vibrations - the breadth is due to the complexity of interference vibrations between hydrogen bonded ethanoic acid molecules.

hydrogen bonding in carboxylic acids forming dimer ethanoic acid benzoic acid advanced organic chemistry revision notes doc brown

One example of a hydrogen bond Oδ--Hδ+ǁǁǁ:Oδ- between ethanoic acid molecules due to the big difference in electronegativity between hydrogen and oxygen.

For more on hydrogen bonding see Physical properties of alcohols (boiling points, solubility) and intermolecular forces

and The physical properties of carboxylic acids - trends discussed and explained, mpts, bpts, solubility, odours

The O-H stretching vibrations overlap with C-H stretching vibrations, typically for alkyl groups at wavenumbers 2975 to 2845 cm-1 (so take care when looking for the presence of a hydroxyl group in a molecule).

The relatively sharp and strong absorption band at wavenumber ~1700 cm-1 is due to the stretching vibration of the C=O (carbonyl group of the carboxylic acid group).

Peaking at wavenumber ~1300 cm-1 are the C-O stretching vibrations of the C-O bond.

Around wavenumber 1400 cm-1 are complex bands due to the interaction of C=O and O-H vibrations.

There is also an O-H vibration band at wavenumber ~900 cm-1.

The presence of strong absorption at wavenumbers for C=O and O-H stretching vibrations are very indicative of a carboxylic acid group in the molecule, but not proof or exclusive e.g. you can have a hydroxy-ketone!

The absence of other specific functional group bands will show that particular functional group is absent from the ethanoic acid molecular structure.

Exam practise questions based on the infrared spectrum of ethanoic acid


Key points about the infrared spectrum of ethanoic acid and exam practise questions

Ethanoic acid’s IR spectrum shows a broad O–H stretch (2500–3300 cm⁻¹), a sharp C=O stretch (~1700 cm⁻¹), and C–O stretches (1200–1300 cm⁻¹).

These are diagnostic of carboxylic acids. Students often confuse the broad acid O–H with alcohol O–H, and examiners test this distinction frequently.


Key IR Spectrum Features of Ethanoic Acid (CH3COOH)

Bond/Functional Group Wavenumber (cm⁻¹) Appearance Notes
O–H (carboxylic acid) 2500–3300 Very broad, overlaps with C–H Broader than alcohol O–H due to hydrogen bonding
C=O (carbonyl) ~1700 Strong, sharp peak Diagnostic of carboxylic acids
C–O stretch 1200–1300 Strong Confirms acid functionality
C–H stretch (alkyl) ~2900 Sharp Less diagnostic
Fingerprint region <1500 Complex Used for molecule identification

Common Misconceptions

  • Confusing O–H stretches: Alcohol O–H (~3200–3600 cm⁻¹, narrower) versus acid O–H (broader, lower range).
  • Overlooking overlap: Acid O–H overlaps with C–H stretches, making interpretation tricky.
  • Assuming all carbonyls are identical: Aldehydes, ketones, esters, and acids all have C=O peaks but differ slightly in wavenumber and accompanying features.
  • Ignoring fingerprint region: Students often skip this, but examiners may ask about its importance in confirming identity.

Exam Revision Tips

  • Always quote approximate wavenumbers (e.g., “~1700 cm⁻¹ for C=O”).
  • Distinguish acid O–H vs. alcohol O–H in written answers.
  • Use multiple peaks together (O–H + C=O + C–O) to confirm carboxylic acid.
  • Be prepared to compare isomers (e.g., ethanoic acid vs. methyl methanoate).
  • Practice interpreting spectra with both functional group regions and fingerprint region.

Practise Multiple Choice Questions based on the infrared spectrum of ethanoic acid

Each question has A–D options, model answer, and feedback explaining distractors.

If you think there are any errors email doc b asap

Jot down your responses and check out the ANSWERS!

Give reasons for your answers


Q1. Which peak confirms the presence of an OH group of a carboxylic acid in ethanoic acid?

  1. Sharp peak at 1700 cm⁻¹
  2. Broad band 2500–3300 cm⁻¹
  3. Sharp peak at 2900 cm⁻¹
  4. Strong band at 1200 cm⁻¹

Q2. Ethanoic acid versus ethanol: which feature distinguishes them?

  1. Broad O–H 2500–3300 cm⁻¹
  2. Sharp O–H 3200–3600 cm⁻¹
  3. C=O at 1700 cm⁻¹
  4. C–H at 2900 cm⁻¹

Q3. Which wavenumber is most diagnostic of a carbonyl group?

  1. 1700 cm⁻¹
  2. 2500–3300 cm⁻¹
  3. 2900 cm⁻¹
  4. 1200 cm⁻¹

Q4. Which isomer of ethanoic acid lacks the broad O–H stretch?

  1. Methyl methanoate
  2. Ethanol
  3. Propanoic acid
  4. Methanal

Q5. Which molecule shows both C=O and broad O–H?

  1. Ethanoic acid
  2. Ethanol
  3. Methyl methanoate
  4. Propanone

Q6. Why is acid O–H broader than alcohol O–H?

  1. Stronger hydrogen bonding
  2. Weaker hydrogen bonding
  3. Presence of C=O
  4. Fingerprint region overlap

Q7. Which peak would be absent in methyl methanoate compared to ethanoic acid?

  1. 1700 cm⁻¹
  2. 2500–3300 cm⁻¹
  3. 1200 cm⁻¹
  4. 2900 cm⁻¹

Q8. Which feature distinguishes aldehydes from acids?

  1. C=O at 1700 cm⁻¹
  2. Fingerprint region
  3. C–H stretch at 2900 cm⁻¹
  4. Acid O–H broad band

Q9. Which molecule shows IR wavenumbers for C=O but no O–H?

  1. Ethanoic acid
  2. Ethanol
  3. Propanone
  4. Propanoic acid

Q10. Which combination confirms carboxylic acid?

  1. C=O + broad O–H + C–O
  2. C=O + sharp O–H
  3. C–H + C–O
  4. Fingerprint region only

Q11 Given our isomers of molecular formula C2H4O2 ...

A CH3COOH

B HCOOCH3

C HOCH=CHOH

D HOCH2CHO

There may be more than one answer.


If you think there are any errors email doc b asap

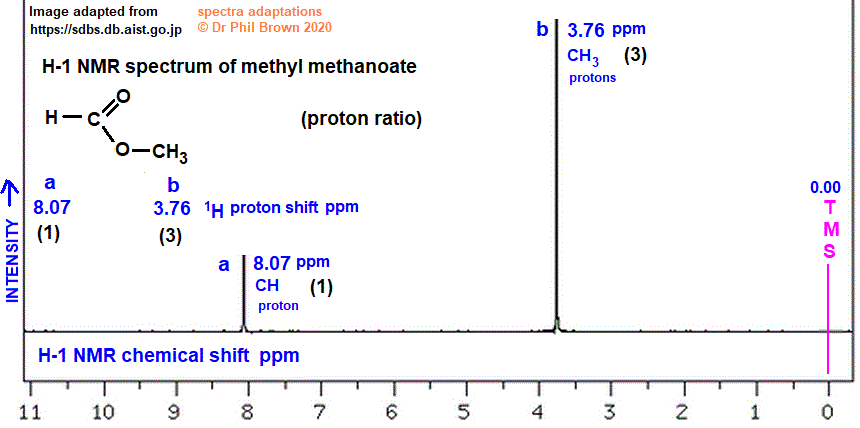
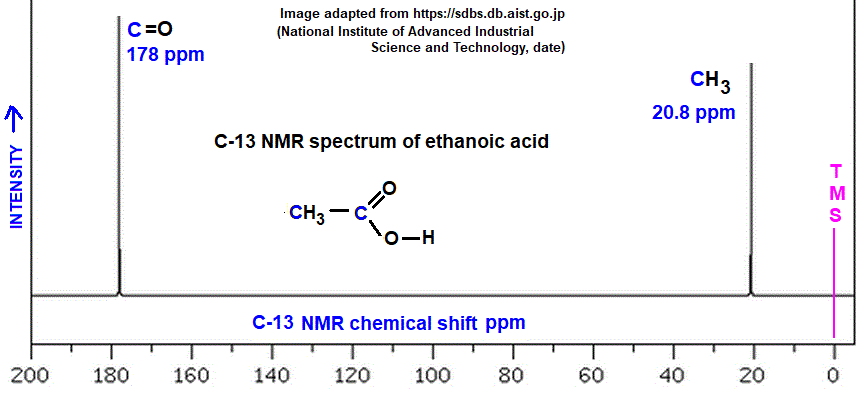
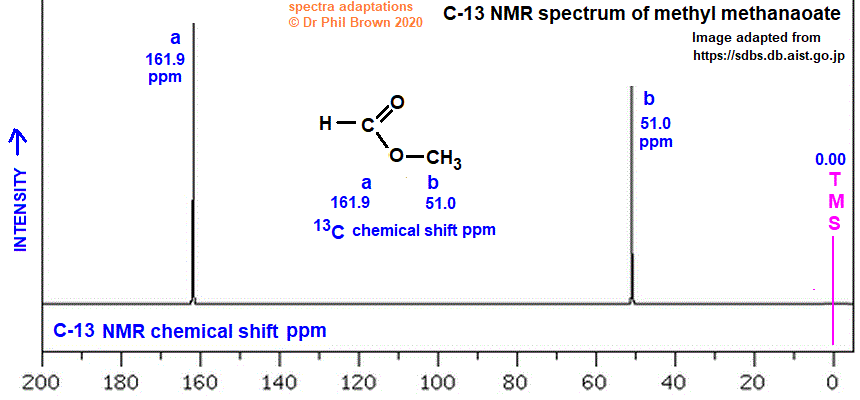
Comparing the infrared, mass, 1H NMR and 13C NMR spectra of the 2 isomers of C2H4O2

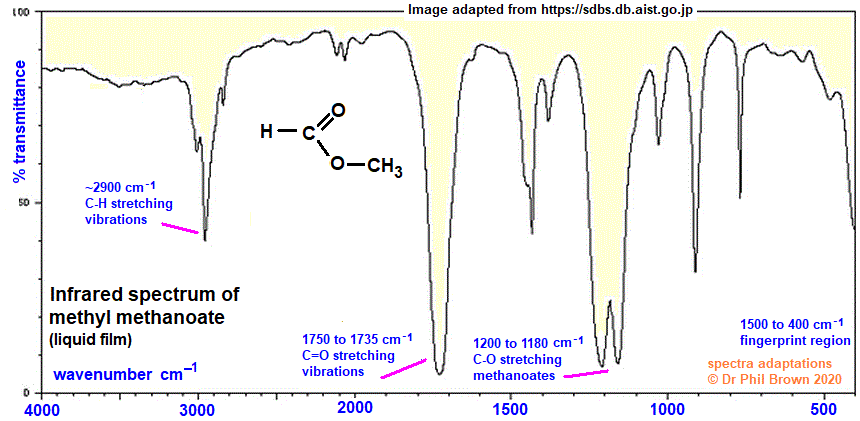
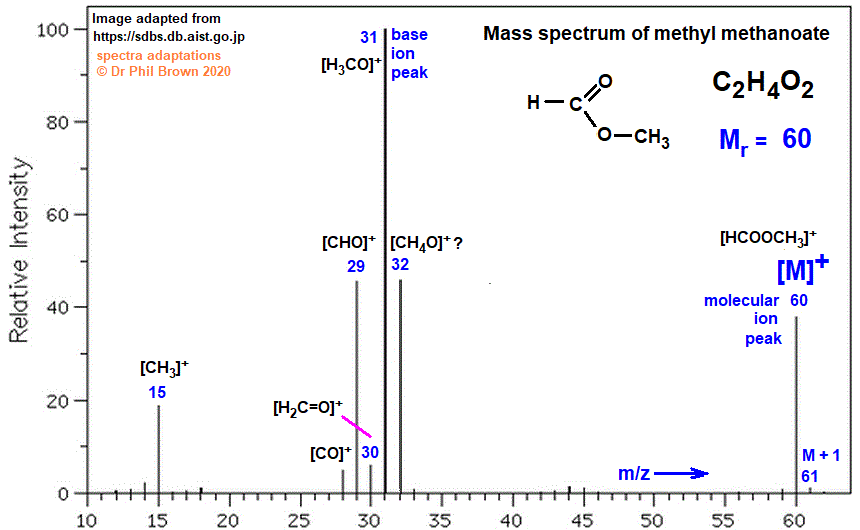
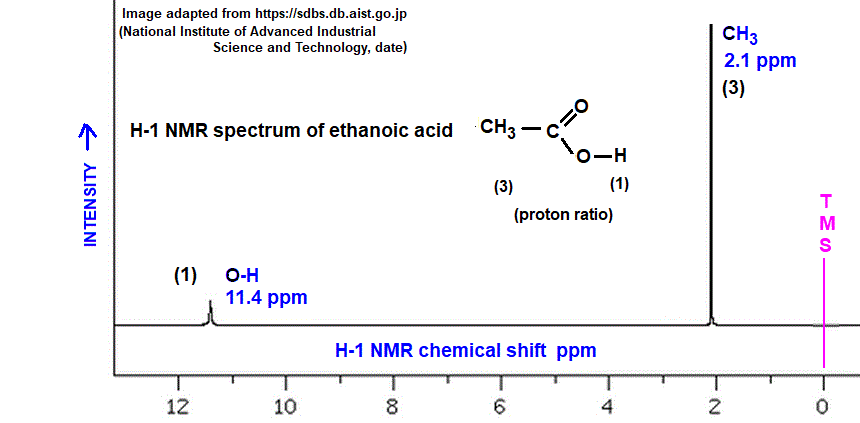
NOTE: The images are linked to their original detailed spectral analysis pages AND can be doubled in size with touch screens to increase the definition to the original ethanoic acid (acetic acid) and methyl methanoate (methyl formate) image sizes. SEE also More on the isomers of C2H4O2

INFRARED SPECTRA: Apart from the significant differences in the fingerprint region at wavenumbers 1500 to 400 cm-1, the most striking difference is the broad O-H stretching band ~3200 cm-1, found in the infrared spectrum of carboxylic acids, but absent in the infrared spectrum of esters. You see this distinguishing broad OH stretching vibration band in the infrared spectrum of ethanoic acid.

MASS SPECTRA: Apart from the m/z of 60 for the parent molecular ion and m/z 15 ion [CH3]+, both ethanoic acid and methyl methanoate show few similarities in their mass spectra. Their base ion peaks are quite different - for ethanoic acid it is m/z 43 and for methyl methanoate it is m/z 31.

1H NMR SPECTRA: The 1H NMR spectra of ethanoic acid and methyl methanoate are similar with two 'wide-apart' chemical shift singlet peaks in the integrated proton ratio of 3:1 (meaning 2 different 1H chemical environments).

13C NMR SPECTRA: The 13C NMR spectra of ethanoic acid and methyl methanoate are similar, both molecules give two C-13 NMR spectral lines (meaning 2 different 13C chemical environments).

Key words & phrases: image and diagram of the infrared spectrum of ethanoic acid, complete infrared absorption spectrum of ethanoic acid, comparative spectra of ethanoic acid, prominent peaks/troughs for identifying functional groups in the infrared spectrum of ethanoic acid, important wavenumber values in cm-1 for peaks/troughs in the infrared spectrum of ethanoic acid, revision of infrared spectroscopy of ethanoic acid, fingerprint region analysis of ethanoic acid, how to identify ethanoic acid from its infrared spectrum, identifying organic compounds like ethanoic acid from their infrared spectrum, how to analyse the absorption bands in the infrared spectrum of ethanoic acid Diagram of absorption of wavenumber peaks in the infrared spectrum of ethanoic acid. Characteristic peak wavenumbers in the infrared spectrum of ethanoic acid. Finger print identification pattern using the infrared spectrum of ethanoic acid. Revision notes on the infrared spectrum of ethanoic acid. Matching and deducing the structure of the ethanoic acid molecule from  its infrared spectrum. Infrared spectroscopy of carboxylic acids, infrared spectra of ethanoic acid, an isomer of molecular formula C2H4O2 How do you interpret the infrared absorption spectrum of ethanoic acid How to interpret the infrared spectrum of ethanoic acid Explanatory diagram of the infrared spectrum of the ethanoic acid molecule in terms of its molecular structure. Listing data of the prominent main wavenumber peaks troughs in the infrared spectrum of ethanoic acid. How to explain the infrared spectrum of ethanoic acid. Use of the infrared spectrum of ethanoic acid, identification of ethanoic acid from its infrared spectrum - fingerprint wavenumber pattern to identify the ethanoic acid molecule. The uses of the infrared spectrum of the ethanoic acid molecule. The distinctive features of the infrared spectrum of the ethanoic acid molecule explained. explaining the peaks-trough of the transmittance of the infrared spectrum of ethanoic acid what does the infrared spectrum tell you about the structure and properties of the ethanoic acid molecule? How do you interpret the infrared absorption spectrum of ethanoic acid CH3COOH How to interpret the infrared spectrum of ethanoic acid CH3COOH Explanatory diagram of the infrared spectrum of the ethanoic acid CH3COOH molecule in terms of its molecular structure. Listing data of the prominent main wavenumber peaks troughs in the infrared spectrum of ethanoic acid CH3COOH. How to explain the infrared spectrum of ethanoic acid CH3COOH. Use of the infrared spectrum of ethanoic acid CH3COOH, identification of ethanoic acid CH3COOH from its infrared spectrum - fingerprint wavenumber pattern to identify the ethanoic acid CH3COOH molecule. The uses of the infrared spectrum of the ethanoic acid CH3COOH molecule. The distinctive features of the infrared spectrum of the ethanoic acid CH3COOH molecule explained interpretation diagram explaining the peaks-trough of the transmittance of the infrared spectrum of ethanoic acid CH3COOH what does the infrared spectrum tell you about the structure and properties of the ethanoic acid CH3COOH molecule? How is infrared spectrum of ethanoic acid CH3COOH used to identify ethanoic acid CH3COOH?


ANSWERS to the multiple choice questions based on the infrared spectrum of ethanoic acid

If you think there are any errors email doc b asap

Q1. Which peak confirms the presence of an OH group of a carboxylic acid in ethanoic acid?

  1. Sharp peak at 1700 cm⁻¹
  2. Broad band 2500–3300 cm⁻¹
  3. Sharp peak at 2900 cm⁻¹
  4. Strong band at 1200 cm⁻¹

Answer: B.

  • A = C=O (seen in aldehydes/ketones too).
  • B = Acid O–H, diagnostic.
  • C = Alkyl C–H, not diagnostic.
  • D = C–O, supportive but not unique.

Q2. Ethanoic acid versus ethanol: which feature distinguishes them?

  1. Broad O–H 2500–3300 cm⁻¹
  2. Sharp O–H 3200–3600 cm⁻¹
  3. C=O at 1700 cm⁻¹
  4. C–H at 2900 cm⁻¹

Answer: C.

  • Ethanol lacks C=O.
  • A = acid O–H, ethanol has narrower O–H.
  • B = ethanol O–H, not acid.
  • D = both have C–H.

Q3. Which wavenumber is most diagnostic of a carbonyl group?

  1. 1700 cm⁻¹
  2. 2500–3300 cm⁻¹
  3. 2900 cm⁻¹
  4. 1200 cm⁻¹

Answer: A.

  • Broad acid O–H is unique.
  • 1700 cm⁻¹ also in aldehydes/ketones.
  • 2900 cm⁻¹ = C–H.
  • 1200 cm⁻¹ = C–O, not unique.

Q4. Which isomer of ethanoic acid lacks the broad O–H stretch?

  1. Methyl methanoate
  2. Ethanol
  3. Propanoic acid
  4. Methanal

Answer: A.

  • Ester has C=O and C–O but no acid O–H.
  • Ethanol has O–H but no C=O.
  • Propanoic acid still has acid O–H, but not an isomer of ethanoic acid.
  • Methanal has C=O only, but not an isomer of ethanoic acid.

Q5. Which molecule shows both C=O and broad O–H?

  1. Ethanoic acid
  2. Ethanol
  3. Methyl methanoate
  4. Propanone

Answer: A.

  • Ethanol = O–H only.
  • Ester = C=O only.
  • Ketone = C=O only.

Q6. Why is acid O–H broader than alcohol O–H?

  1. Stronger hydrogen bonding
  2. Weaker hydrogen bonding
  3. Presence of C=O
  4. Fingerprint region overlap

Answer: A.

  • Correct: acid O–H strongly hydrogen bonded, more sites for H-bonding than e.g. ethanol..

Q7. Which peak would be absent in methyl methanoate compared to ethanoic acid?

  1. 1700 cm⁻¹
  2. 2500–3300 cm⁻¹
  3. 1200 cm⁻¹
  4. 2900 cm⁻¹

Answer: B.

  • Ester lacks acid O–H.

Q8. Which feature distinguishes aldehydes from acids?

  1. C=O at 1700 cm⁻¹
  2. Fingerprint region
  3. C–H stretch at 2900 cm⁻¹
  4. Acid O–H broad band

Answer: D.

  • Aldehydes lack acid O–H.

Q9. Which molecule shows IR wavenumbers for C=O but no O–H?

  1. Ethanoic acid
  2. Ethanol
  3. Propanone
  4. Propanoic acid

Answer: C.

  • Ketone has C=O only.

Q10. Which combination confirms carboxylic acid?

  1. C=O + broad O–H + C–O
  2. C=O + sharp O–H
  3. C–H + C–O
  4. Fingerprint region only

Answer: A.

  • All three together confirm acid.

Q11 Given our isomers of molecular formula C2H4O2 ...

A CH3COOH

B HCOOCH3

C HOCH=CHOH

D HOCH2CHO

There may be more than one answer.

(a) Which molecule will not give an absorption for a wavenumber corresponding to C=O stretching vibrations?

ANSWER: C, has a C=C bond, the other three have a C=O bond in the molecule.

(a) Which molecule will not give a strong broad absorption for a wavenumber corresponding to an O-H stretching vibrations?

ANSWER: B, the only one with no OH group in the molecule.


If you think there are any errors email doc b asap


Links associated with ethanoic acid

The mass spectrum of Ethanoic acid (acetic acid)

The H-1 NMR spectrum of Ethanoic acid (acetic acid)

The C-13 NMR spectrum of Ethanoic acid (acetic acid)

The chemistry of CARBOXYLIC ACIDS and DERIVATIVES revision notes INDEX

Isomers of molecular formula C2H4O2 (Mr = 60)

Infrared spectroscopy index

ALL SPECTROSCOPY INDEXES

All my pre-university Advanced Level Organic Chemistry Notes

Use My Google search site box

Email doc b: chem55555@hotmail.com

 Index of sets of isomers for a given molecular formula, some include IR and NMR spectroscopy data

 The chemistry of ALKANES and the petrochemical industry

 The chemistry of ALKENES

 The chemistry of organic HALOGEN compound (haloalkanes)

 The chemistry of ALCOHOLS (mention of ethers)

 The chemistry of ALDEHYDES and KETONES

 The chemistry of CARBOXYLIC ACIDS, ESTERS and other derivatives

 The chemistry of ORGANIC-NITROGEN compound e.g. amines

 The chemistry of AROMATIC COMPOUNDS - benzene and derivatives


Website content © Dr Phil Brown 2000+. All copyrights reserved on revision notes, images, quizzes, worksheets etc. Copying of Doc Brown's pre-university/college advanced level chemistry website material is NOT permitted. Exam revision summaries & references to chemistry course specifications are unofficial. These organic chemistry revision notes on the spectroscopy of ethanoic acid (acetic acid) - its infrared spectrum of ethanoic acid is analysed and explained and suitable for use of pre-university students studying AQA advanced level chemistry, Edexcel advanced level chemistry, OCR advanced level chemistry, IB advanced level chemistry, WJEC (Eduqas) advanced level chemistry, CIE Cambridge advanced level chemistry, US grade 11-12 AP honors chemistry courses and they will also prove useful to 1st year undergraduate students of chemistry.

TOP OF PAGE and indexes