|
Interpreting
and explaining the mass
spectrum of propane
[Author
©
Dr Phil Brown PhD:
Doc Brown's advanced level organic chemistry exam revision notes
suitable for students of UK A level chemistry courses & US K12 grade
11, grade 12 and AP honors chemistry courses:
Molecular
spectroscopy analysis of
propane
[spectra page
updated Mar 26th 2026 *]
Email
doc brown re-edit mass spectrum of
C3H8
CH3CH2CH3
This is a BIG chemistry website, PLEASE take time to explore it
Mass spectrometry - spectra index
Links associated
with propane
* [privacy policy, cookies
and disclaimer]
See also
comparing the infrared, mass, 1H
NMR and 13C NMR
spectra of propane, cyclopropane and propene
Introductory note on the mass spectrum of propane
Students and teachers please note
my explanation of the mass spectrum of propane is designed for
advanced, but pre-university, chemistry courses.
If M represents the
propane molecule, the initial ionisation to give the molecular ion is:
M(g) +
high KE e- ==> [M•]+(g) + 2e-
and for fragmentation equations assume [M]+ is the start of the
processes and all species are in a gaseous state.
I've not usually shown an unpaired electron on e.g. an ion or a non-ionised
alkyl radical R e.g.
[M•]+ ==> [X]+ + R•,
but you should be aware this is a more accurate depiction of some
processes.
I've used simplified equations to show how some of
the ions that might be formed in the fragmentation pattern for the
mass spectrum of propane and only the formation of singly charged
positive are considered for the mass spectrum of propane.
I've included a stick diagram and table of m/z ions for the mass spectrum of
propane
and doing the mass spectrum analysis under standard conditions,
databases can be compiled based on complex fingerprint patterns, often involving
the relative intensities of many fragment ions, and used to identify compounds including
propane.
In selected cases, where two
different fragment ions have the same integer m/z value,
I've pointed out that modern mass spectrometers can measure
relative ion mass to four decimal places. So, using
accurate isotopic masses, I've calculated the accurate ion
masses, BUT strictly speaking, 0.0005 should be deducted
for singly charged ions to account for the loss of the
electron in their formation. I have NOT done this for
propane,
but the mass spectrometer software does!

Propane C3H8,
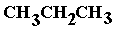 , ,
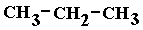 ,
,
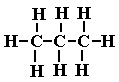 ,
,
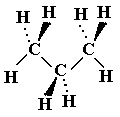 alkane
Interpreting the fragmentation pattern of the mass spectrum of propane
[M]+ is the molecular ion peak (M) with an m/z of
44 corresponding to [C3H8]+, the original propane molecule minus an electron,
[CH3CH2CH3]+
The small M+1 peak at m/z 45, corresponds to an ionised
propane
molecule with one 13C atom in it i.e. an ionised propane molecule of
formula [13C12C2H8]+
Carbon-13 only accounts for ~1% of all carbon atoms
(12C ~99%), but the more carbon atoms in the molecule,
the greater the probability of observing this 13C M+1
peak.
Propane has 3 carbon atoms, so on
average, ~1 in 33 molecules will contain a 13C atom.
The most abundant ion of the molecule under mass
spectrometry investigation (propane) is usually given an arbitrary abundance value of
100, called the base ion peak, and all other abundances
('intensities') are measured against it.
The base ion peak for the mass spectrum of
propane is the m/z 29 ion
[C2H5]+
Identifying the species giving the most prominent peaks
(apart from M) in the fragmentation pattern of propane.
Unless otherwise indicated, assume the carbon atoms in
propane are the 12C isotope.
Some of the possible positive ions, [molecular fragment]+,
formed in the mass spectrometry of propane.
The parent molecular ion of propane
is the m/z 44 ion
[CH3CH2CH3]+
|
m/z value of
[fragment]+ |
43 |
42 |
41 |
39 |
38 |
29 |
28 |
27 |
26 |
15 |
|
[molecular fragment]+ |
[C3H7]+ |
[C3H6]+ |
[C3H5]+ |
[C3H3]+ |
[C3H2]+ |
[C2H5]+ |
[C2H4]+ |
[C2H3]+ |
[C2H2]+ |
[CH3]+ |
Analysing and explaining the principal ions in the
fragmentation pattern of the mass spectrum of propane
PLEASE NOTE
I have found it difficult to find 'authentic' equations to explain mass
spectra fragmentation patterns and it is complex chemistry! I've identified
the formulae of the ionised fragments on the mass spectrum diagram, but the
equations are from the internet or my conjecture as to how the ions might be
formed - please take care in using the information, especially for
assignments at university or pre-university level.
Atomic masses: H = 1; C = 12
(~1% 13)
Bond enthalpies = kJ/mol: C-C = 348;
C-H = 412
Possible
equations to explain the most abundant ion peaks of propane
(tabulated above)
Formation of m/z 43 ion:
[CH3CH2CH3]+ ===> [CH3CH2]+
+ H
C-H bond scission in
the parent molecular ion, loss hydrogen,
mass change 44
- 1 = 43 (M-1 ion peak)
Formation of m/z 42 to 37 ions:
These can be formed by success hydrogen atom loss
starting with the m/z 43 ion.
In fact the m/z 42 ion could be formed by elimination of
hydrogen from the parent molecular ion.
[CH3CH2CH3]+ ===> [CH2CH2]+
+ H2
Formation of m/z 29 ion:
[CH3CH2CH3]+ ===> [CH3CH2]+
+ CH3
C-C bond scission of the parent molecular ion, loss
methyl group,
mass change 44 - 15 = 29
(M-15 ion peak)
The m/z 29 ion is the base peak ion, the most
abundant and 'stable' ion fragment.
The m/z 30 ion is probably [13C12CH5]+.
i.e. the C2H5 fragment with one carbon-13
isotope,
though it could be formed
by C-C bond scission of the parent molecular ion, with loss of CH2
[CH3CH2CH3]+ ===> [CH3CH3]+
+ CH2
Note that an accurate mass
spectrometer can sort out ions with the same integer m/z value
because they can measure relative fragment ion
masses to four decimal places.
e.g. using accurate relative isotopic masses:
1H
= 1.0078 12C
= 12.0000 13C = 13.0034,
from which you can calculate (predict)
that the accurate relative ion masses are:
For m/z 30:
[13C12CH5]+ = 30.0424,
[C2H6]+ = 30.0468, a difference of
0.0044 in relative ion mass.
Formation of m/z 27 ion:
[C2H5]+ ===> [C2H3]+
+ H2
Elimination of a hydrogen molecule from the m/z 29
ion, mass change 29 - 2 = 27.
In fact the m/z 28 to 26 ions are formed by
successive hydrogen loss from the m/z 29 ion.
Formation of m/z 15 ion:
[CH3CH2CH3]+ ===> [CH3]+
+ CH3CH2
C-C bond scission, loss of ethyl group from parent
molecular ion,
mass change 44 - 29 = 15, but
this time the methyl group carries the positive charge.
|
Comparing the infrared, mass, 1H NMR and 13C NMR
spectra of propane, cyclopropane and propene
NOTE: The images are linked to their
original detailed spectral analysis pages AND can be doubled in
size with touch screens to
increase the definition to the original ethane and
ethene image sizes. |
 |
 |
 |
Comparing the
infrared
spectra of propane, propene and cyclopropane.
Cyclopropane and propene are structural isomers of molecular formula C3H6.
Propane
and propene exemplify the infrared spectra of lower members of the alkane
and alkene homologous series of CnH2n+2 and CnH2n
hydrocarbon
molecules where n = 3. |
|
INFRARED SPECTRA
(above):
Apart from the significant differences in the fingerprint region at
wavenumbers 1500 to 400 cm-1, the most striking
differences are: (i) propene shows the characteristic absorption
at ~1700 cm-1 for the C=C stretching vibrations,
absent in the other two spectra, (ii) cyclopropane shows an absorption band
at 2200 cm-1, absent in the other two spectra, (iii)
propane has an absorption band at ~750 cm-1, absent
in the other two spectra. |
 |
 |
 |
Comparing the
mass
spectra of propane, propene and cyclopropane.
Cyclopropane and propene are structural isomers of molecular formula C3H6.
Propane
and propene exemplify the mass spectra of lower members of the alkane
and alkene homologous series of CnH2n+2 and CnH2n
hydrocarbon
molecules where n = 3. |
|
MASS SPECTRA (above):
All three hydrocarbons show some similarities in their mass
spectra e.g. m/z ions 26 to 28 for [C2Hx]+
(x = 2 to 4) and m/z 14 and 15 ions - but these are found in
most aliphatic hydrocarbon spectra. The molecular ion peaks will
be the same for the isomeric propene and cyclopropane (m/z 42)
but that of propane will be 2 mass units higher at m/z 44. The
base ion peak m/z values are all different, propane 29, propene
41 and cyclopropane 42. |
 |
 |
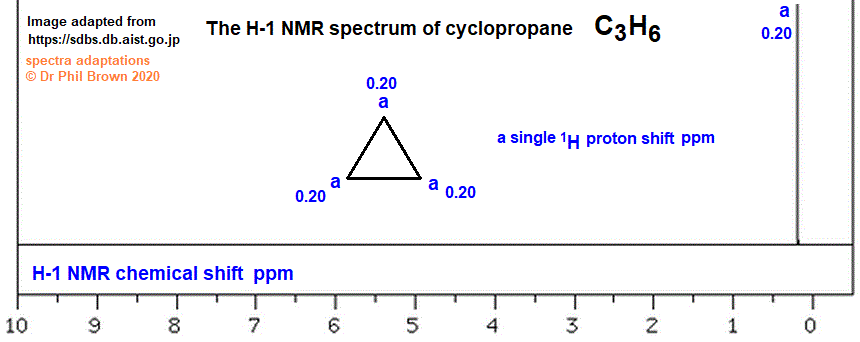 |
Comparing the
1H proton NMR
spectra of propane, propene and cyclopropane.
Cyclopropane and propene are structural isomers of molecular formula C3H6.
Propane
and propene exemplify the 1H proton NMR spectra of lower members of the alkane
and alkene homologous series of CnH2n+2 and CnH2n
hydrocarbon
molecules where n = 3. |
|
1H NMR SPECTRA (above): The 1H NMR spectra of
all three molecules give different proton ratios i.e. propane
3:1 (actually 6:2 in the molecule), propene 2:1:3 (spectrum and
molecule) and cyclopropane just a singlet for the six protons,
so all three can be distinguished from each other by their
1H NMR spectra.. |
 |
 |
 |
Comparing the
carbon-13 NMR
spectra of propane, propene and cyclopropane.
Cyclopropane and propene are structural isomers of molecular formula C3H6.
Propane
and propene exemplify the carbon-13 NMR spectra of lower members of the alkane
and alkene homologous series of CnH2n+2 and CnH2n
hydrocarbon
molecules where n = 3. |
|
13C NMR SPECTRA
(above): The
13C NMR spectra of the three molecules show different numbers of
carbon-13 chemical environments i.e propane 2, propene 3 and cyclopropane
only 1, so all three could be distinguished from each other. |
Key words & phrases: C3H8 CH3CH2CH3 image diagram on how to interpret and explain the mass spectrum of
propane m/z m/e base peaks, image and diagram of the mass spectrum of
propane, details of the mass spectroscopy of propane, low and high resolution mass
spectrum of propane, prominent m/z peaks in the mass spectrum of propane, comparative
mass spectra of propane, the molecular ion peak in the mass spectrum of propane,
analysing and understanding the fragmentation pattern of the mass spectrum
of propane, characteristic pattern of peaks in the mass spectrum of propane, relative
abundance of mass ion peaks in the mass spectrum of propane, revising the mass
spectrum of propane, revision of mass spectroscopy of propane, most abundant ions in the
mass spectrum of propane, how to construct the mass spectrum diagram for abundance
of fragmentation ions in the mass spectrum of propane, how to analyse the mass
spectrum of propane, how to describe explain the formation of fragmented ions in the
mass spectra of propane equations for explaining the formation of the positive ions
in the fragmentation of the ionised molecule of propane recognising the base ion
peak of propane interpreting interpretation the mass spectrum of propane
alkane
functional group Stick diagram of the relative abundance
of ionised fragments in the fingerprint pattern of the mass spectrum of
propane. Table of the m/e m/z values and formula of the ionised fragments in the
mass spectrum of propane. The m/e m/z value of the molecular ion peak in the
mass spectrum of propane. The m/e m/z value of the base ion peak in the
mass spectrum of propane. Possible examples of equations showing the formation
of the ionised fragments in propane. Revision notes on the mass spectrum of
propane.
Matching and deducing the structure of the propane molecule from its mass
spectrum. How do you interpret the mass spectrum of
propane How to interpret
the mass spectrum of propane Explanatory diagram of the mass spectrum of the
propane molecule in
terms of its molecular structure.
Table listing data of the m/z ion prominent main peaks in the mass spectrum of
propane. How to explain the mass spectrum of propane. The m/z value of the
molecular ion peak in the mass spectrum of propane. Identifying
propane from
its mass spectrum pattern. The m/z m/e peak analysis interpretation
diagram of the mass
spectrum of the propane molecule. The uses of the mass spectrum of the
propane molecule. The distinctive features of the mass spectrum of
the propane molecule explained. explaining the fragmentation pattern of the mass spectrum of
propane equations showing the
formation of the ionised fragments in the mass spectrum of propane
what does the mass spectrum tell you about the structure and
properties of the propane molecule? Data table of ionised fragments in
the mass spectrum of propane and equations for their formation in the
fragmentation of the ionised propane molecule.
Links associated
with
propane
The chemistry of ALKANES
revision notes INDEX
The infrared
spectrum of propane
The H-1 NMR spectrum of propane
The C-13 NMR
spectrum of propane
Mass spectroscopy index
ALL SPECTROSCOPY INDEXES
All Advanced Organic
Chemistry Notes
Use My Google search site box
Email doc b:
chem55555@hotmail.com
Website content © Dr
Phil Brown 2000+. All copyrights reserved on revision notes, images,
quizzes, worksheets etc. Copying of Doc Brown's pre-university
advanced level chemistry website material is NOT
permitted. Exam revision summaries & references to science course specifications
are unofficial. These organic chemistry revision notes on
spectroscopy (on the mass spectrum of propane) are
suitable for use of pre-university students studying AQA advanced level
chemistry, Edexcel advanced level chemistry, OCR advanced level
chemistry, IB advanced level chemistry, WJEC (Eduqas) advanced level
chemistry, CIE advanced level chemistry, CCEA advanced level chemistry, US grade 11-12 AP honors
chemistry courses and they will also prove useful to
1st year undergraduate students of chemistry. |
