|
Interpreting and
explaining the infrared
spectrum of ethane
[Author
©
Dr Phil Brown PhD:
Doc Brown's advanced level organic chemistry exam revision notes
suitable for students of UK A level chemistry courses & US K12 grade
11, grade 12 and AP honors chemistry courses: Molecular
spectrometry - analysing the 1H NMR spectra of ethane
[spectra
page updated
April 3rd 2026 *]
email doc brown
Re-edit
infrared spectrum of
CH3CH3
Links associated with ethane
* [privacy policy, cookies
and disclaimer]
This is a BIG chemistry website, PLEASE take time to explore it
Infrared spectroscopy - spectra index
See also
comparing the infrared, mass, 1H NMR and 13C NMR spectra of ethane and
ethene
Introductory note on the infrared spectrum of ethane
Students and teachers please note
my explanation of the infrared
spectrum of ethane is designed
for advanced, but pre-university, chemistry courses.
Based in
the infrared spectrum diagram for ethane, only some of the most
prominent peaks for particular bond vibrations are discussed,
particularly if ethane has a functional group with a particular
characteristic wavenumber peak.
The infrared spectrum of ethane is
unique and the whole, or selected wavenumbers, can be used to
fingerprint its identity, sometimes analysing a mixture
containing ethane or following its change of concentration in a
reaction.
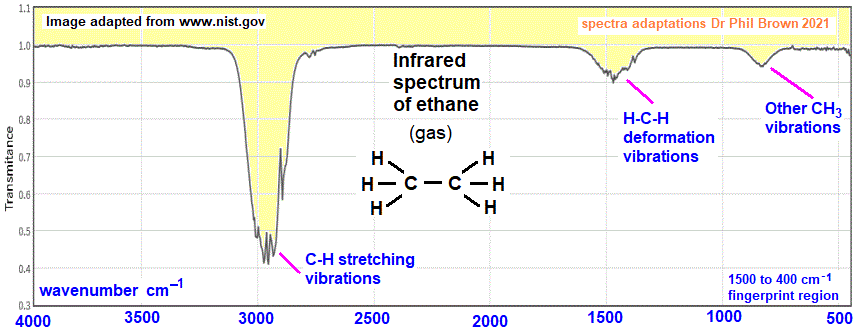
Spectra obtained from a liquid film of ethane. The right-hand part of the of the
infrared spectrum of ethane, wavenumbers
~1500 to 400
cm-1 is considered the fingerprint region for the
identification of ethane and most organic compounds. It is due to a unique set
of complex overlapping vibrations of the atoms of the molecule of ethane.
The alkane
ethane


 yes! just a dash! yes! just a dash!
The molecular structure and
naming of alkanes
Interpretation of
the infrared spectrum of ethane
The most prominent infrared absorption lines of ethane
Typical alkyl C-H stretching vibrations occur at
wavenumbers peaking ~2900 cm-1.
Typical alkyl H-C-H deformation vibrations occur at
wavenumbers peaking ~1450 cm-1.
Other alkyl CH3 vibrations occur at
wavenumbers peaking ~800 cm-1.
Ethane is a very small symmetrical molecule and hence the relatively
simple infrared spectrum.
The absence of other specific functional group bands
will show that a particular functional group is absent from the
ethane
molecular
structure.
|
Comparing the infrared, mass, 1H NMR and 13C NMR
spectra of
ethane and ethene
NOTE: The images are linked to their
original detailed spectral analysis pages AND can be doubled in
size with touch screens to
increase the definition to the original ethane and
ethene image sizes. |
|
|
 |
|
INFRARED SPECTRA:
Apart from the significant differences in the fingerprint region at
wavenumbers 1500 to 400 cm-1, the most striking
differences are (i) the band at ~1900 cm-1 for ethene,
absent in the ethane spectrum, (ii) the bands at 800 cm-1
for ethane (CH3 vibrations), absent or much weaker in
ethene, and (iii) the strong absorptions at ~1000 cm-1
for ethene, completely absent in the ethane spectrum. The
infrared spectrum of ethane looks simple, but this may lack of
resolution. |
 |
 |
|
MASS SPECTRA: Both
ethane and ethene show some similarities in their mass
spectra e.g. m/z ions 25 to 28 for [C2Hx]+
(x = 1 to 4) ions and in both cases the base ion peak has an m/z
of 28. However, the molecular ion peaks will be different
because of their different relative molecular masses i.e. ethane
m/z 30 and ethene m/z 28. Ethane also has a prominent m/z ion
peak of 29, which is tiny in the ethene mass spectrum (and only
due to 1% 13C atoms in the parent molecular ion). |
 |
 |
|
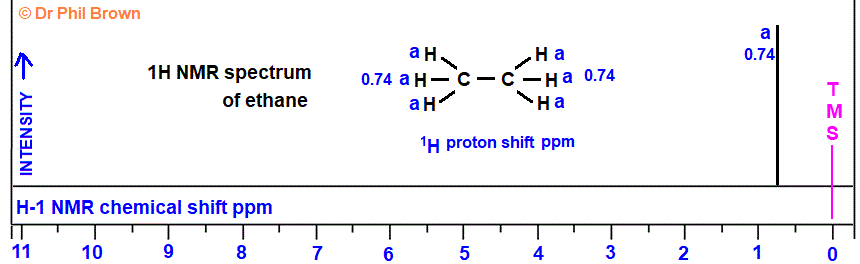
1H NMR SPECTRA: The 1H NMR spectra of
ethane and ethene are similar in that that both give one single
singlet resonance line in their proton NMR spectra. All the
protons in each molecule are equivalent to each other and occupy
the same chemical environment due to the symmetry of the
molecule, so no resonance splitting. However the two 1H
chemical shifts are significantly different due the different
shielding effects of the -CH3 and =CH2
groupings respectively. |
 |
 |
|
13C NMR SPECTRA: The
1C NMR spectra of ethane and ethene are similar in that that
both give one single resonance line in their carbon-13 NMR
spectra. In both molecules the two carbon atoms occupy the same
chemical environment due to the symmetry of the molecule.
However the two 13C chemical shifts are significantly
different due the different shielding effects of the -CH3
and =CH2
groupings respectively. |
Key words & phrases: C2H6 CH3CH3 image and diagram explaining the infrared spectrum
of ethane, complete infrared absorption spectrum of ethane, comparative spectra of
ethane, prominent peaks/troughs for identifying functional groups in the infrared spectrum of
ethane,
important wavenumber values in cm-1 for peaks/troughs in the infrared spectrum
of ethane, revision of infrared spectroscopy of ethane, fingerprint region analysis of
ethane, how to identify ethane from its infrared spectrum, identifying organic
compounds like ethane from their infrared spectrum,
how to analyse the absorption bands in the infrared spectrum of ethane detection of functional groups in the
ethane molecule example of the infrared spectrum of a
molecule like ethane with a
functional group
interpreting interpretation of the infrared spectrum of ethane shows presence
of functional group
alkane functional group
How do you interpret the infrared absorption spectrum of
ethane How
to interpret the infrared spectrum of ethane Explanatory diagram of the
infrared spectrum of the ethane molecule in terms of its molecular
structure. Listing data of the prominent main wavenumber peaks
troughs in the infrared spectrum of ethane. How to explain the infrared
spectrum of ethane. Use of the infrared spectrum of ethane, identification
of ethane from its infrared spectrum - fingerprint wavenumber pattern
to identify the ethane molecule. The uses of the infrared spectrum of
the ethane molecule. The distinctive features of the infrared spectrum
of the ethane molecule explained interpretation diagram explaining the
peaks-trough of the transmittance of the infrared spectrum of ethane
what does the infrared spectrum tell you about the structure and
properties of the ethane molecule? How is infrared spectrum of
ethane used
to identify ethane?
Links associated with ethane
The chemistry of ALKANES
revision notes INDEX
The
mass spectrum of ethane
The H-1 NMR spectrum of
ethane
The C-13 NMR spectrum of ethane
Infrared spectroscopy index
ALL SPECTROSCOPY INDEXES
All Advanced Organic
Chemistry Notes
Use My Google search site box
Email doc b:
chem55555@hotmail.com
Website content © Dr
Phil Brown 2000+. All copyrights reserved on revision notes, images,
quizzes, worksheets etc. Copying of Doc Brown's pre-university
advanced level chemistry website material is NOT
permitted. Exam revision summaries & references to science course specifications
are unofficial. These organic chemistry revision notes on
spectroscopy (infrared spectra of ethane) are
suitable for use of pre-university students studying AQA advanced level
chemistry, Edexcel advanced level chemistry, OCR advanced level
chemistry, IB advanced level chemistry, WJEC (Eduqas) advanced level
chemistry, CIE advanced level chemistry, CCEA advanced level chemistry, US grade 11-12 AP honors
chemistry courses and they will also prove useful to
1st year undergraduate students of chemistry. |
