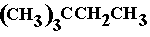
Advanced Organic Chemistry: Mass spectrum of 2,2-dimethylbutane (CH3)3CCH2CH3 HOME PAGE * SEARCH * GCSE Level Chemistry age ~14-16 * Advanced Level Chemistry age ~16-19
|
Interpreting the mass spectrum of 2,2-dimethylbutane [Author © Dr WP Brown PhD: Doc Brown's advanced level organic chemistry exam revision notes suitable for students of UK A level chemistry courses & US K12 grade 11, grade 12 and AP honors chemistry courses: Mass spectrometry - analysing the mass spectrum of 2,2-dimethylbutane [updated Nov 4th 2025] Re-edit mass spectrum of CH3CH2C(CH3)3Links associated with 2,2-dimethylbutane This is a BIG website, PLEASE take time to explore it Mass spectrometry - spectra index See also comparing infrared, mass, 1H NMR & 13C NMR spectra of the structural alkane isomers of C6H14 Introductory note on the mass spectrum of 2,2-dimethylbutane
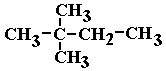
2,2-dimethylbutane C6H14,
For more see The molecular structure, classification and naming of alkanes
[M]+ is the molecular ion peak (M) with an m/z of 86 corresponding to [C6H14]+, the original 2,2-dimethylbutane molecule minus an electron, [(CH3)3CCH2CH3]+, BUT it doesn't seem to show up!
An M+1 peak at m/z 87, could correspond to an ionised 2,3-dimethylbutane molecule with one 13C atom in it i.e. an ionised 2,2-dimethylbutane molecule of formula 13C12C5H14, BUT this is even less likely to show up!
Identifying the species giving the most prominent peaks (apart from M) in the fragmentation pattern of 2,2-dimethylbutane. The most abundant ion of the molecule under mass spectrometry investigation is usually given an arbitrary abundance value of 100, called the base ion peak, and all other abundances ('intensities') are measured against it.
Formation of m/z 57 ion:
Formation of m/z 43 ion:
Formation of m/z 29 ion:
Sequences including m/z values of 57, 56 55 or 43, 42, 41, 40, 39 or 29, 28, 28, 27, 26, indicate successive hydrogen atom loss from the m/z 57, 43 or 29 ions. Key points about the mass spectrum of 2,2-dimethylbutane
|
|||||||||||||||||||||||||||||||||||||||||||||||||||||||||||||||||||||||||||||||||||||||||
 ,
,
 ,
,

|
m/z |
Fragment |
Origin / Explanation |
|---|---|---|
|
57 |
C4H9⁺ (tert-butyl) |
Loss of ethyl group (C2H5); forms stable tertiary carbocation — base peak |
|
43 |
C3H7⁺ (propyl or isopropyl) |
Common alkyl fragment; formed by further cleavage of larger fragments |
|
71 |
C5H11⁺ |
Loss of methyl group (CH3); less stable than m/z 57 but still prominent |
|
29 |
C2H5⁺ |
Ethyl fragment; often seen in alkanes |
|
41 |
C3H5⁺ |
Allylic-type fragment; less common in saturated alkanes |
|
86 |
C6H14⁺ (M⁺) |
Molecular ion; very weak due to extensive fragmentation |
Common Misconceptions in Exams
-
Assuming the molecular ion is always the base peak: Not true for branched alkanes like 2,2-dimethylbutane.
-
Confusing m/z 57 with other alkyl group: It's actually a tert-butyl cation (C4H9⁺).
-
Overlooking fragmentation stability: Tertiary carbocations are more stable and thus more abundant.
-
Thinking all alkanes fragment similarly: Branching significantly alters fragmentation patterns.
Exam Revision Tips (AQA, Edexcel, OCR, WJEC, CCEA, CIE, IB, AP)
-
Know your fragmentation logic: Focus on stability — tertiary > secondary > primary.
-
Practice with isomers: Compare spectra of n-hexane vs. 2,2-dimethylbutane to understand structural effects.
-
Use peak tables: Learn common m/z values for alkyl fragments m/z 15 = CH3⁺, 29 = C2H5⁺, 43 = C3H7⁺, 57 = C4H9⁺, but not always of diagnostic use..
-
Sketch fragmentation routes: Helps visualize how ions form.
-
Watch for base peak vs. molecular ion: They are often different in branched hydrocarbons.
-
For IB and AP: Emphasize interpretation, not just memorization — explain why certain peaks dominate.
|
Comparing the infrared, mass, 1H NMR and 13C NMR
spectra of the five structural alkane isomers of C6H14 NOTE: The images are linked to their original detailed spectral analysis pages AND can be doubled in size with touch screens to increase the definition to the original hexane, 2-methylpentane, 3-methylpentane, 2,2-dimethylbutane and 2,3-dimethylbutane image sizes. These five molecules are structural isomers of saturated alkanes of molecular formula C6H14 and exemplify the infrared, mass, 1H NMR and 13C NMR spectra of lower aliphatic alkanes (non-cyclic alkanes). |
|
| Infrared spectra below. | |
 |
 |
 |
INFRARED SPECTRA: Apart from the significant differences in the fingerprint region at wavenumbers 1500 to 400 cm-1, there are no other great striking differences, but each could be identified from its infrared spectrum. All the absorption bands are typical of molecules containing saturated alkyl structure and there are no characteristic infrared absorptions due to a specific functional group. |
 |
 |
| Infrared spectra above, mass spectra below. | |
 |
 |
 |
MASS SPECTRA: Base ion peaks plus m/z comments. Hexane: m/z 57, 42 and 56 prominent 2-methylpentane: m/z 43, 42 and 71 prominent 3-methylpentane: m/z 57, 41 and 56 prominent 2,2-dimethylbutane: m/z 43, 41, 57 and 71 prominent 2,3-dimethylbutane: m/z 43, 41, 42 and 71 prominent |
 |
 |
| Mass spectra above, 1H NMR spectra below. | |
 |
 |
 |
1H NMR SPECTRA: They can all be distinguished by their different integrated proton ratios - need very high resolution. Hexane: 3 1H δ shifts, H ratio 3:2:2 (6:4:4 in formula) 2-methylpentane: 5 1H δ shifts, H ratio 6:3:2:2:1 3-methylpentane: 4 1H δ shifts, H ratio 6:4:3:1 2,2-dimethylbutane: 3 1H δ shifts, H ratio 9:3:2 2,3-dimethylbutane: 2 1H δ shifts, H ratio 6:1 (12:2 in formula) |
 |
 |
| 1H NMR spectra above, 13C NMR spectra below. | |
 |
 |
 |
13C NMR SPECTRA: From the number of shifts, you can't distinguish (iii) and (iv) but you can distinguish them from (i), (ii) and (v). (i) Hexane: 3 13C δ shifts (ii) 2-methylpentane: 5 13C δ shifts (iii) 3-methylpentane: 4 13C δ shifts (iv) 2,2-dimethylbutane: 4 13C δ shifts (v) 2,3-dimethylbutane: 2 13C δ shifts |
 |
 |
| 13C NMR spectra above. | |
Key words & phrases: image diagram on how to interpret and explain the mass spectrum of 2,2-dimethylbutane m/z m/e base peaks, image and diagram of the mass spectrum of 2,2-dimethylbutane, details of the mass spectroscopy of 2,2-dimethylbutane, low and high resolution mass spectrum of 2,2-dimethylbutane, prominent m/z peaks in the mass spectrum of 2,2-dimethylbutane, comparative mass spectra of 2,2-dimethylbutane, the molecular ion peak in the mass spectrum of 2,2-dimethylbutane, analysing and understanding the fragmentation pattern of the mass spectrum of 2,2-dimethylbutane, characteristic pattern of peaks in the mass spectrum of 2,2-dimethylbutane, relative abundance of mass ion peaks in the mass spectrum of 2,2-dimethylbutane, revising the mass spectrum of 2,2-dimethylbutane, revision of mass spectroscopy of 2,2-dimethylbutane, most abundant ions in the mass spectrum of 2,2-dimethylbutane, how to construct the mass spectrum diagram for abundance of fragmentation ions in the mass spectrum of 2,2-dimethylbutane, how to analyse the mass spectrum of 2,2-dimethylbutane, how to describe explain the formation of fragmented ions in the mass spectra of 2,2-dimethylbutane equations for explaining the formation of the positive ions in the fragmentation of the ionised molecule of 2,2-dimethylbutane recognising the base ion peak of 2,2-dimethylbutane interpreting interpretation the mass spectrum of 2,2-dimethylbutane Stick diagram of the relative abundance of ionised fragments in the fingerprint pattern of the mass spectrum of 2,2-dimethylbutane. Table of the m/e m/z values and formula of the ionised fragments in the mass spectrum of 2,2-dimethylbutane. The m/e m/z value of the molecular ion peak in the mass spectrum of 2,2-dimethylbutane. The m/e m/z value of the base ion peak in the mass spectrum of 2,2-dimethylbutane. Possible examples of equations showing the formation of the ionised fragments in 2,2-dimethylbutane. Revision notes on the mass spectrum of 2,2-dimethylbutane. Matching and deducing the structure of the 2,2-dimethylbutane molecule from its mass spectrum. Mass spectroscopy of aliphatic alkanes, mass spectra of 2,2-dimethylbutane, a structural isomer of molecular formula C6H14 How do you interpret the mass spectrum of 2,2-dimethylbutane How to interpret the mass spectrum of 2,2-dimethylbutane Explanatory diagram of the mass spectrum of the 2,2-dimethylbutane molecule in terms of its molecular structure. Listing data of the prominent main peaks in the mass spectrum of 2,2-dimethylbutane. How to explain the mass spectrum of 2,2-dimethylbutane. The m/z value of the molecular ion peak in the mass spectrum of 2,2-dimethylbutane. Identifying 2,2-dimethylbutane from its mass spectrum pattern. The m/z m/e peak analysis interpretation diagram of the mass spectrum of the 2,2-dimethylbutane molecule. The uses of the mass spectrum of the 2,2-dimethylbutane molecule. The distinctive features of the mass spectrum of the 2,2-dimethylbutane molecule explained. explaining the fragmentation pattern of the mass spectrum of 2,2-dimethylbutane equations showing the formation of the ionised fragments in the mass spectrum of 2,2-dimethylbutane what does the mass spectrum tell you about the structure and properties of the 2,2-dimethylbutane molecule? Data table of ionised fragments in the mass spectrum of 2,2-dimethylbutane and equations for their formation in the fragmentation of 2,2-dimethylbutane molecules
Links associated with 2,2-dimethylbutane
The chemistry of ALKANES revision notes INDEX
The infrared spectrum of 2,2-dimethylbutane
The H-1 NMR spectrum of 2,2-dimethylbutane
The C-13 NMR spectrum of 2,2-dimethylbutane
All Advanced Organic Chemistry Notes
Email doc b: chem55555@hotmail.com
Website content © Dr Phil Brown 2000+. All copyrights reserved on revision notes, images, quizzes, worksheets etc. Copying of Doc Brown's pre-university advanced level chemistry website material is NOT permitted. Exam revision summaries & references to science course specifications are unofficial. These organic chemistry revision notes on spectroscopy are suitable for use of pre-university students studying AQA advanced level chemistry, Edexcel advanced level chemistry, OCR advanced level chemistry, IB advanced level chemistry, WJEC (Eduqas) advanced level chemistry, CIE advanced level chemistry, US grade 11-12 AP honors chemistry courses and they will also prove useful to 1st year undergraduate students of chemistry.
