|
Interpreting the
1H NMR spectrum of 1-chlorobutane
[Author
©
Dr Phil Brown PhD:
Doc Brown's advanced level organic chemistry exam revision notes
suitable for students of UK A level chemistry courses & US K12 grade
11, grade 12 and AP honors chemistry courses: Molecular
spectroscopy - analysing the H-1 proton NMR spectrum of 1-chlorobutane
[updated
Mar 11th 2026 *]
email doc
brown * [privacy policy,
cookies & disclaimer] * Re-edit
1H NMR
spectrum of CH3CH2CH2CH2Cl
LINKS associated
with 1-chlorobutane
The
chemistry of organic halogen compounds
This is a BIG
website, you need to take time to explore it
H-1 proton NMR spectroscopy -
spectra index
See also
Comparing infrared, mass, 1H NMR & 13C NMR
spectra of the 4 structural isomers of C4H9Cl
Introductory note on the 1H NMR spectra of 1-chlorobutane
Students and teachers please note my explanation of the
proton NMR spectrum of 1-chlorobutane is designed for advanced, but
pre-university, chemistry courses.
The chemical shift
δ splitting pattern effects for
1-chlorobutane are
confined to a proton spin-spin
coupling effects analysed using the n+1 rule for adjacent
non-equivalent proton fields (n is the number of neighbouring
protons in a non-equivalent different chemical environment for the
1-chlorobutane molecule).
It is assumed that the integrated intensities of the
1H
NMR δ
chemical shifts give the ratio of the protons in the different
non-equivalent chemical environments of the 1-chlorobutane molecule.
The most common solvent used for investigating the 1H NMR
spectrum of compounds like 1-chlorobutane, is CDCl3 and other
deuterated solvents to avoid confusion with a 1H NMR
signal, 2D (2H) has a different NMR chemical
shift.

TMS is the acronym for tetramethylsilane, formula Si(CH3)4,
whose protons are arbitrarily given a chemical shift of 0.0 ppm.
This is the 'standard' in 1H NMR spectroscopy and all
other proton shifts, called chemical shifts, depend on the
individual (electronic) chemical environment of the hydrogen atoms
in an organic molecule, 1-chlorobutane here.
The chemical shifts quoted in ppm on the diagram of
the H-1 NMR spectrum of 1-chlorobutane represent the peaks of the intensity of
the chemical shifts (which are often groups of split lines at
high resolution) AND the relative integrated areas under the peaks
gives you the ratio of protons in the different chemical
environments of the 1-chlorobutane molecule.
1-chlorobutane C4H9Cl,
 , ,
 , ,

For more see
Molecular structure, classification and
naming of
halogenoalkanes (haloalkanes)
Interpreting the
H-1 NMR spectrum of 1-chlorobutane
In terms of spin-spin coupling from the possible proton magnetic orientations,
for 1-chlorobutane I
have only considered the interactions of
non-equivalent protons on adjacent carbon atoms
e.g.
-CH2-CH3
or >CH-CH3
or R-CH2-CH2-X
protons etc.
For relatively simple molecules, the low
resolution H-1 NMR spectrum of 1-chlorobutane is a good starting point
- just blur the above 4 sets of chemical shift lines above -
which clearly show that there 4 sets of protons in different
chemical environments.
You can illustrate this with a coloured
structural formula of 1-chlorobutane.
CH3CH2CH2CH2Cl
(note the 4 colours indicating the 4 different chemical environment of
the hydrogen atoms).
The proton ratio is 3 : 2 : 2 : 2 for the four different proton environments
giving four principal and different chemical shift peaks at low
resolution.
As you can see, the high resolution spectrum
of 1-chlorobutane is complex when applying the n+1 rule
(a) The left-hand end CH3 is split by the
adjacent CH2 into a 1 : 2 : 1 triplet at 0.92 ppm
(n+2 = 3).
(d) The right-hand end CH2 is split into
a 1 : 2 : 1 triplet by the adjacent CH2 at 3.42 (n+2
= 3)
However, the two 'inner' sets of CH2 protons are
split on both sides by adjacent non-equivalent protons into
multiple resonance lines.
CH3CH2CH2CH2Cl
(b) The 1.41 ppm chemical shift:
From the n+1 rule, the 'left-hand' CH2
protons (H2)
are split
by CH3 protons (H3) and by
the middle CH2 protons (H2),
(5 protons in total), into a 1:5:10:10:5:1 sextet of
resonance lines (n+5 = 6).
This is pattern of resonances is a good
indication of a propyl group (CH3CH2CH2).
(c) The 1.68 ppm chemical shift:
The middle CH2 protons (H2)
are split on both sides by CH2 protons (H2
and
H2), (4
protons in total), into a 1:4:6:4:1 quintet of resonance
lines (n+2 = 5).
Summary of the H-1 proton NMR spectrum of 1-chlorobutane and
extra comments
A structured breakdown of the ¹H NMR spectrum of
1-chlorobutane (C4H9Cl), with
emphasis on chemical shifts, proton environments,
integration, and exam-relevant insights.
Overview:
Proton Environments in 1-Chlorobutane
1-Chlorobutane is a straight-chain primary
haloalkane with the structure:
CH3–CH2–CH2–CH2–Cl
It contains four distinct proton environments,
each with characteristic chemical shifts and splitting
patterns due to neighboring protons.
Table:
Chemical Shifts, Origins, and Integration for the
H-1 proton NMR spectrum of 1-chlorobutane
|
Proton |
Group |
Chemical Shift (δ, ppm) |
Origin / Environment |
Multiplicity |
Integration |
| Hd |
–CH2–Cl |
~3.4–3.6, 3.42 ppm |
Deshielded by electronegative
Cl |
Triplet |
2H |
| Hc |
–CH2–CH2–Cl |
~1.6–1.8, 1.68 ppm |
Adjacent to CH2–Cl |
Multiplet |
2H |
| Hb |
–CH2–CH2–CH2 |
~1.3–1.5, 1.41 ppm |
Mid-chain CH2 |
Multiplet |
2H |
| Ha |
–CH3 |
~0.9–1.0, 0.92 ppm |
Terminal methyl group |
Triplet |
3H |
CH3CH2CH2CH2Cl
Note: Exact shifts may vary slightly
depending on solvent and instrument, but the pattern remains consistent.
Common
Misconceptions about the
H-1 proton NMR spectrum of 1-chlorobutane
(see also below)
- Assuming all CH₂ groups are equivalent:
Despite similar environments, each CH2 has a
unique chemical shift due to differing proximity to Cl or CH3.
- Misidentifying the CH2–Cl peak:
It appears furthest downfield (~3.5 ppm) due to
deshielding by chlorine, not because it's aromatic
or part of a double bond.
- Overlooking splitting patterns:
Students often forget that multiplicity arises from
n+1 rule, where n is the number of
neighboring protons.
Exam Tips
if questions involve the
H-1 proton NMR spectrum of 1-chlorobutane
(see also above)
- Start with integration: Use the 3H
triplet to identify the methyl group, then work backward.
- Use chemical shift logic: The most
downfield signal (~3.5 ppm) is from the CH₂ next to Cl — a
key identifier for haloalkanes.
- Check multiplicity carefully:
Multiplets in the middle of the chain may overlap —
sketching the molecule helps clarify neighbours.
- Compare with isomers: 2-chlorobutane
will show different splitting and chemical shifts due to
branching — useful in structure deduction.
- Link to IR and MS: In synoptic
questions, combine NMR with IR (C–Cl stretch) and MS
(M⁺/M⁺+2 peaks) for full analysis.
The splitting pattern from proton
spin-spin coupling effects is analysed using the n+1 rule for
adjacent non-equivalent proton fields (n is the number of
neighbouring protons in a non-equivalent different chemical
environment).
|
Number of protons 1H
causing splitting |
Splitting pattern produced from the
n+1 rule and the theoretical ratio of line intensities |
|
0
means no splitting |
|
|
|
|
|
|
1 |
|
|
|
|
|
|
|
1
creates a doublet |
|
|
|
|
|
1 |
|
1 |
|
|
|
|
|
|
2
creates a triplet |
|
|
|
|
1 |
|
2 |
|
1 |
|
|
|
|
|
3
creates a quartet |
|
|
|
1 |
|
3 |
|
3 |
|
1 |
|
|
|
|
4
creates a quintet |
|
|
1 |
|
4 |
|
6 |
|
4 |
|
1 |
|
|
|
5
creates a sextet |
|
1 |
|
5 |
|
10 |
|
10 |
|
5 |
|
1 |
|
|
6
creates a septet |
1 |
|
6 |
|
15 |
|
20 |
|
15 |
|
6 |
|
1 |
|
Comparing the infrared, mass, 1H NMR and 13C NMR
spectra of the 4 halogenoalkane isomers of C4H9Cl
NOTE: The images are linked to their
original detailed spectral analysis pages AND can be doubled in
size with touch screens to
increase the definition to the original 1-chlorobutane,
2-chlorobutane, 1-chloro-2-methylpropane and 2-chloro-2-methylpropane
image sizes. These four molecules
are structural isomers of molecular formula C4H9Cl
and
exemplify the infrared, mass, 1H NMR and 13C NMR spectra of lower
aliphatic halogenoalkanes (haloalkanes, alkyl halides,
chloroalkanes, alkyl chlorides). |
 |
 |
 |
 |
|
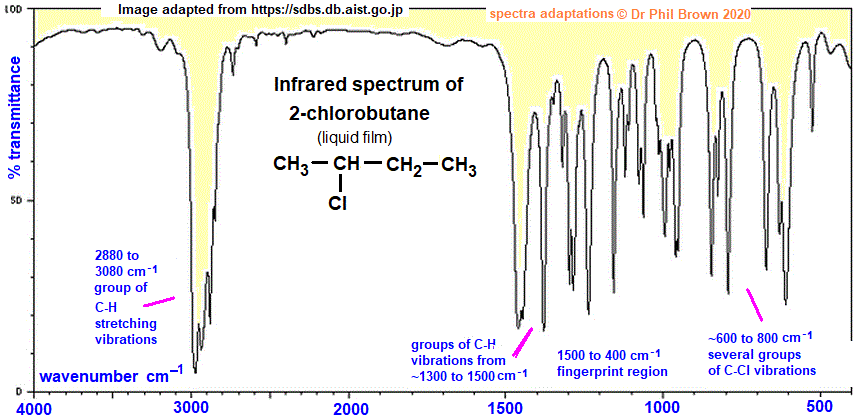
INFRARED SPECTRA
(above):
Apart from the significant differences in the fingerprint region at
wavenumbers 1500 to 400 cm-1, there are no other
great striking differences, but each could be identified from
its infrared spectrum. The infrared spectrum of
2-chloro-2-methylpropane is noticeably simpler in the
fingerprint region, perhaps due to
the greater symmetry of the molecule. |
 |
 |
 |
 |
|
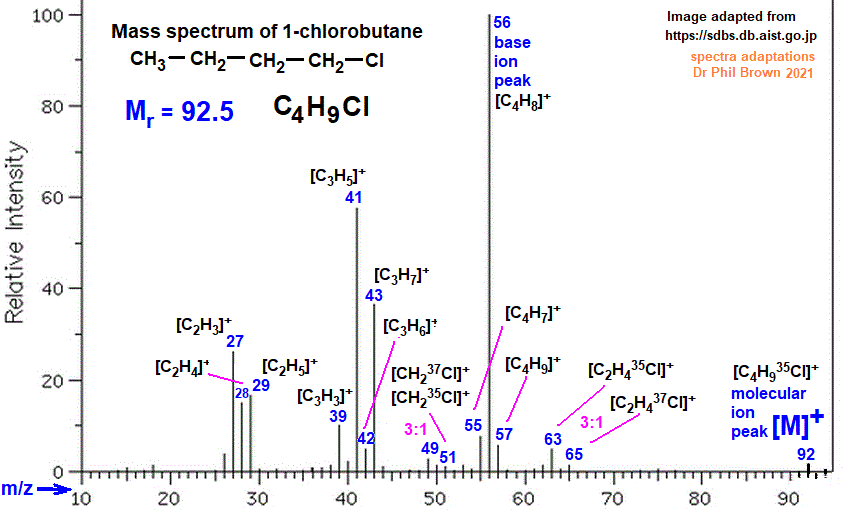
MASS SPECTRA (above):
Theoretically, all four can give the parent molecular ions of
m/z 92 and 94, but they are all relatively tiny peaks.
2-chlorobutane and 2-chloro-2-methylpropane give a base ion peak
of m/z 57. The base ion peak for 1-chlorobutane is m/z 56 and
that of 1-chloro-2-methylpropane is m/z 43. Each gives different
patterns of pairs of m/z values two mass units apart, in the
peak height ratio of 3:1, if the positive fragment contains a
chlorine atom (35Cl or 37Cl) e.g look for
m/z pairs 49/51, 63/65 and 77/79 in their mass spectra. |
|
|
 |
 |
 |
|
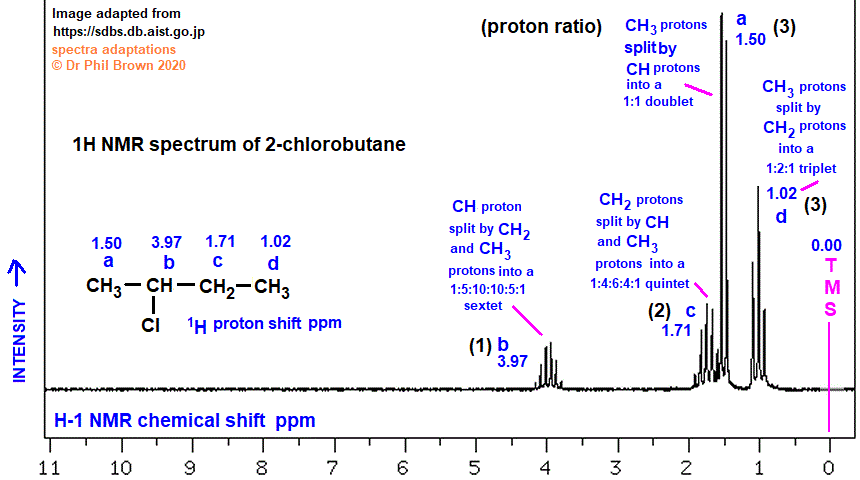
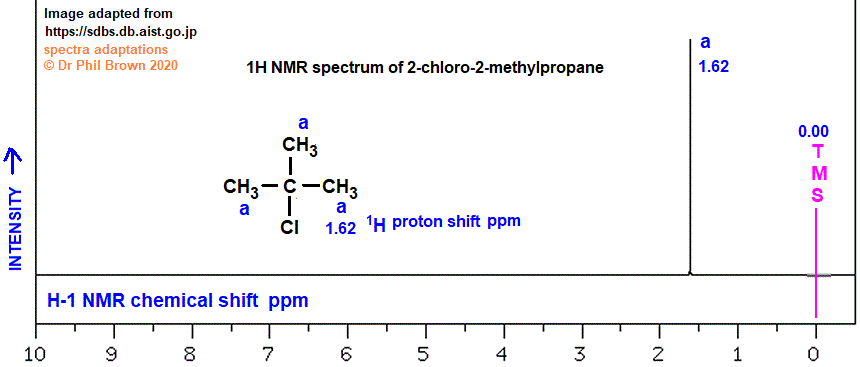
1H NMR SPECTRA
(above): The 1H NMR spectra of all four molecules give different
integrated proton ratios i.e.1-chlorobutane
four peaks of ratio 3:2:2:2; 2-chlorobutane four peaks of
ratio 3:3:2:1,
1-chloro-2-methylpropane three peaks of ratio 6:2:1 and
2-chloro-2-methylpropane gives just one peak '1' (effectively no ratio
involved), so all four molecular structures can be distinguished from each other by their
1H NMR spectra proton ratios, numbers of peaks and (n+1)
rule splitting patterns. |
 |
 |
 |
 |
|
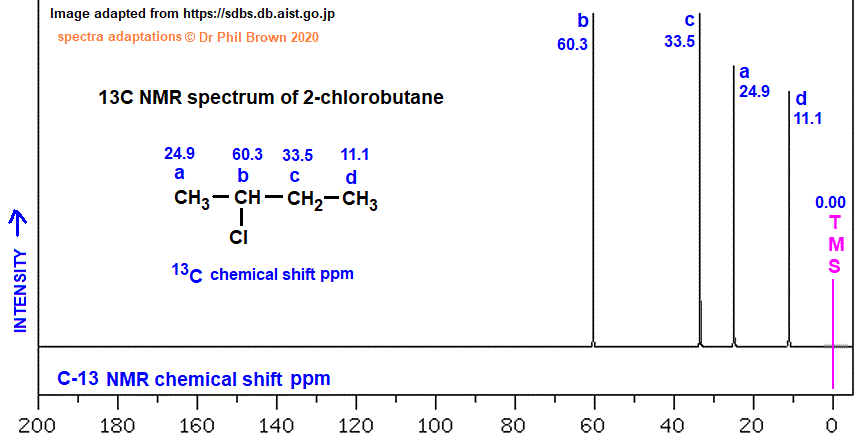
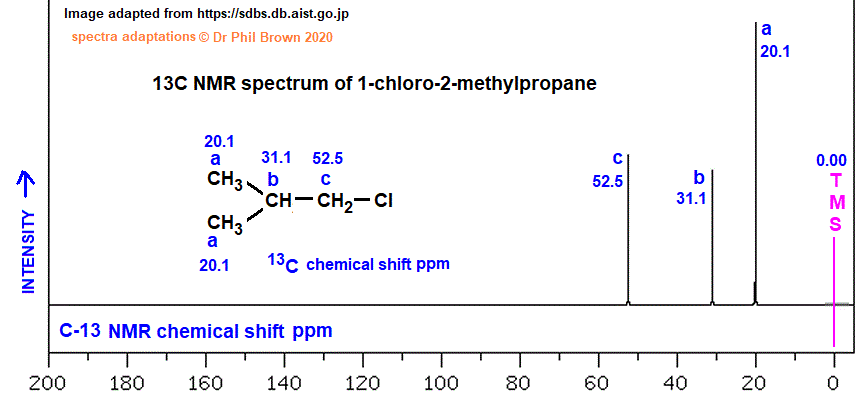
13C NMR SPECTRA
(above): The
13C NMR spectra of the four molecules show various numbers of
carbon-13 chemical environments i.e 1-chlorobutane and
2-chlorobutane show four 13C NMR resonances,
1-chloro-2-methylpropane three 13C NMR resonances and
2-chloro-2-methylpropane only two 13C resonances (3 and 2
chemical environments respectively. Therefore
1-chloro-2-methylpropane and 2-chloro-2-methylpropane can be
distinguished from the other three by their number of resonances
in their 13C NMR spectra, but 1-chlorobutane and 2-chlorobutane
cannot be distinguished from each other from their number of 13C
NMR resonance lines - other data would be required. |
Key words & phrases: Interpreting the proton H-1 NMR spectra of
1-chlorobutane, low resolution & high resolution proton
nmr spectra of 1-chlorobutane, H-1 nmr spectrum of 1-chlorobutane, understanding the
hydrogen-1 nmr spectrum of 1-chlorobutane, explaining the line splitting patterns in the
high resolution H-1 nmr spectra of 1-chlorobutane, revising the H-1 nmr spectrum of
1-chlorobutane,
proton nmr of 1-chlorobutane, ppm chemical shifts of the H-1 nmr spectrum of
1-chlorobutane,
explaining and analyzing spin line splitting in the H-1 nmr spectrum, how
to construct the diagram of the H-1 nmr spectrum of 1-chlorobutane, how to work out the
number of chemically different protons in the structure of the 1-chlorobutane
organic molecule, how to analyse the chemical shifts in the hydrogen-1 H-1
proton NMR spectrum of 1-chlorobutane
Molecular structure diagram of the
proton NMR diagram for the 1H NMR spectrum of 1-chlorobutane. The proton ratio in the
1H NMR spectrum of 1-chlorobutane. Deducing the number of different chemical
environments of the protons in the 1-chlorobutane molecule from the 1H chemical shifts
in the hydrogen-1 NMR spectrum of 1-chlorobutane. Analysing the high resolution 1H NMR
spectrum of 1-chlorobutane. Analysing the low resolution 1H NMR spectrum of
1-chlorobutane. You
may need to know the relative molecular mass of 1-chlorobutane to deduce the molecular
formula from the proton ratio of the 1H NMR spectrum of 1-chlorobutane. Revision notes
on the proton NMR spectrum of 1-chlorobutane. Matching and deducing the structure of
the 1-chlorobutane molecule from its hydrogen-1 NMR spectrum.
Proton NMR spectroscopy of aliphatic
halogenoalkanes haloalkanes alkyl halides alkyl chlorides chloroalkanes,
1H NMR spectra of 1-chlorobutane, an isomer of molecular formula
C4H9Cl explaining the proton 1H NMR
spectrum of 1-chlorobutane
How do you interpret the H-1 NMR spectrum of
1-chlorobutane How to interpret
the H-1 NMR spectrum of 1-chlorobutane Explanatory diagram of the chemical
shifts of the 1H H-1 proton NMR spectrum of the 1-chlorobutane
molecule in terms of its molecular structure. Listing data of all the chemical shift peaks in ppm in the
proton NMR spectrum of 1-chlorobutane. How to explain the H-1 NMR spectrum of
1-chlorobutane. The chemical shifts and integrated values of the proton ratios in the 1-H NMR
spectrum of the 1-chlorobutane molecule. How to work out the molecular
structure of the 1-chlorobutane molecule from its proton NMR spectrum. The uses
and distinctive features of the proton NMR spectrum of the
1-chlorobutane
molecule explained. What does the H-1 proton NMR spectrum chemical
shifts tell us about the
structure and properties of the 1-chlorobutane
molecule? explaining the spin-spin proton coupling effects in the 1H
NMR spectrum of 1-chlorobutane. diagram explaining the proton splitting pattern produced from the
n+1 rule and the theoretical ratio of chemical shift and
values of intensities for the proton NMR spectrum lines of 1-chlorobutane
Links associated with 1-chlorobutane
The chemistry of HALOGENOALKANES (haloalkanes)
revision notes INDEX
The infrared spectrum of 1-chlorobutane
(n-butyl chloride)
The mass spectrum of 1-chlorobutane
(n-butyl chloride)
The C-13 NMR
spectrum of 1-chlorobutane
(n-butyl chloride)
H-1 proton NMR spectroscopy index
(Please
read 8 points at the top of the 1H NMR index page)
ALL SPECTROSCOPY INDEXES
All Advanced Organic
Chemistry Notes
Use My Google search site box
Email doc b:
chem55555@hotmail.com
|
