Advanced Organic Chemistry: Infrared spectrum of 2,2,3-trimethylbutane (CH3)2CHC(CH3)3 HOME PAGE * SEARCH * GCSE Level Chemistry age ~14-16 * Advanced Level Chemistry age ~16-19
|
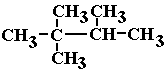
Interpreting the infrared spectrum of 2,2,3-trimethylbutane [Author © Dr Phil Brown PhD: Doc Brown's advanced level organic chemistry exam revision notes suitable for students of UK A level chemistry courses & US K12 grade 11, grade 12 & AP honors chemistry courses: Molecular spectroscopy - analysing infrared spectrum of 2,2,3-trimethyl butane [spectra updated Mar 19th 2026 *] Re-edit infrared spectrum of (CH3)3CCH(CH3)2This is a BIG website, PLEASE take time to explore it Links associated with 2,2,3-trimethylbutane Infrared spectroscopy - spectra index * [privacy, cookies & disclaimer policies] See also comparing the 1H NMR and 13C NMR spectra of the nine alkane structural isomers of C7H16 Introductory note on the infrared spectrum of 2,2,3-trimethylbutane
2,2,3-trimethylbutane C7H16
For more see The molecular structure, classification and naming of alkanes
Key points about the infrared spectrum of 2,2,3-trimethylbutane and a practice question
|
|||||||||||||||||||||||||||||||||||||||||||||||||||||||||||||||||||||||||||||||||||

| Wavenumber (cm⁻¹) | Bond Type | Vibration Mode | Notes |
|---|---|---|---|
| ~2950–2850 | C–H (sp³) stretch | Asymmetric & symmetric | Strong, broad region typical of alkanes |
| ~1470–1450 | C–H bending (scissoring) | Medium intensity | Often appears as a pair of peaks |
| ~1380–1365 | C–H bending (methyl symmetric deformation) | Medium–strong | Characteristic of –CH3 groups |
| ~720 | C–H rocking (long-chain methylene) | Weak–medium | May be weak or absent in branched alkanes |
No absorption above 3000 cm⁻¹ (no =C–H or O–H), and no strong peaks in the fingerprint region from polar groups.
Common Misconceptions
| Misconception | Clarification |
|---|---|
| "All organic molecules show strong IR peaks" | Not true—saturated hydrocarbons like 2,2,3-trimethylbutane show only weak-to-moderate C–H features |
| "Fingerprint region always helps identify the molecule" | For simple alkanes, the fingerprint region is not very diagnostic |
| "No peaks = no molecule" | A lack of strong peaks (e.g. no O–H, C=O) doesn't mean no molecule—just that it's non-polar or lacks IR-active groups |
Exam Revision Tips
- Know what’s absent: For alkanes like 2,2,3-trimethylbutane, the absence of O–H (~3300 cm⁻¹), C=O (~1700 cm⁻¹), C=C (~1620-1680 cm⁻¹) or C≡C/C≡N (~2100–2260 cm⁻¹) is as important as what’s present.
- Focus on C–H stretches: Recognize the 2950–2850 cm⁻¹ region as typical of saturated hydrocarbons.
- Compare spectra: Be ready to distinguish between alkanes, alkenes, alcohols, and ketones based on key peaks.
- Use IR with other data: IR alone won’t distinguish between isomers—combine with NMR or MS in multi-technique questions.
Practice Question
Q:
The IR spectrum of a hydrocarbon shows strong absorptions at 2960 cm⁻¹ and 2870
cm⁻¹, medium peaks at 1465 cm⁻¹ and 1375 cm⁻¹, and no significant absorption
above 3000 cm⁻¹ or around 1700 cm⁻¹.
Which of the following is the most likely identity of the compound?
- 2,2,3-Trimethylbutane
- Cyclohexanone
- 1-Hexene
- Butan-2-ol
Model Answer
Correct answer: A. 2,2,3-Trimethylbutane
Justification:
- 2960 & 2870 cm⁻¹ → C–H stretches of sp³ hybridized carbons (alkane)
- 1465 & 1375 cm⁻¹ → C–H bending (methyl and methylene groups)
- No O–H (~3300 cm⁻¹) → rules out alcohols (D)
- No C=O (~1700 cm⁻¹) → rules out ketones (B)
- No =C–H (~3100 cm⁻¹) or C=C (~1650 cm⁻¹) → rules out alkenes (C)
Thus, the spectrum is consistent with a branched alkane like 2,2,3-trimethylbutane.
|
Comparing the 1H NMR and 13C NMR spectra of the nine alkane structural isomers of C7H16 You can distinguish all 9 isomers from a data combination of their number of 1H NMR chemical shifts, and their resulting integrated 1H proton ratios, plus, their number of 13C chemical shifts. |
||||
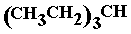
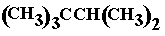
| Name of the alkane structural isomer of molecular formula C7H16 | Abbreviated structural formulae of the nine isomers of molecular formula C7H16 (interpretation complications with 3-methylhexane and 2,3-dimethylpentane because they exhibit R/S isomerism due to a chiral carbon) | Skeletal formula of the nine alkane isomers of molecular formula C7H16 | Number of 1H NMR chemical shifts (δ) and proton ratio (links to spectrum) | Number of 13C chemical shifts (δ) (links to spectrum) |
| heptane |
 |
 |
4 δ: proton ratio: 3:2:2:1 (6:4:4:2 in the molecule) | 4 δ shifts |
| 2-methylhexane |
 |
 |
6 δ: proton ratio : 6:3:2:2:2:1 | 6 δ shifts |
| 3-methylhexane |
 |
 |
7 δ: proton ratio: 3:3:3:2:2:2:1 (simplification) ! | 7 δ shifts |
| 3-ethylpentane |
 |
 |
3 δ: proton ratio: 9:6:1 | 3 δ shifts |
| 2,2-dimethylpentane |
 |
 |
4 δ: proton ratio: 9:3:2:2 | 5 δ shifts |
| 2,3-dimethylpentane |
 |
 |
6 δ: proton ratio: 6:3:3:2:1:1 (simplification) ! | 6 δ shifts (simplification) !!! |
| 2,4-dimethylpentane |
 |
 |
3 δ: proton ratio: 12:2:2 | 3 δ shifts |
| 3,3-dimethylpentane |
 |
 |
3 δ: proton ratio: 3:3:2 (6:4:4 in the molecule) | 4 δ shifts |
| 2,2,3-trimethylbutane |
 |
 |
3 δ: proton ratio: 9:6:1 | 4 δ shifts |
Key words & phrases: C7H16 image and diagram explaining the infrared spectrum of 2,2,3-trimethylbutane, complete infrared absorption spectrum of 2,2,3-trimethylbutane, comparative spectra of 2,2,3-trimethylbutane, prominent peaks/troughs for identifying functional groups in the infrared spectrum of 2,2,3-trimethylbutane, important wavenumber values in cm-1 for peaks/troughs in the infrared spectrum of 2,2,3-trimethylbutane, revision of infrared spectroscopy of 2,2,3-trimethylbutane, fingerprint region analysis of 2,2,3-trimethylbutane, how to identify 2,2,3-trimethylbutane from its infrared spectrum, identifying organic compounds like 2,2,3-trimethylbutane from their infrared spectrum, how to analyse the absorption bands in the infrared spectrum of 2,2,3-trimethylbutane detection of ? functional groups in the 2,2,3-trimethylbutane molecule example of the infrared spectrum of a molecule like 2,2,3-trimethylbutane with no functional group interpreting interpretation of the infrared spectrum of 2,2,3-trimethylbutane shows presence of no functional group (CH3)3CCH(CH3)2 (H3C)3CCH(CH3)2 Diagram of absorption of wavenumber peaks in the infrared spectrum of 2,2,3-trimethylbutane. Characteristic peak wavenumbers in the infrared spectrum of 2,2,3-trimethylbutane. Finger print identification pattern using the infrared spectrum of 2,2,3-trimethylbutane. Revision notes on the infrared spectrum of 2,2,3-trimethylbutane. Matching and deducing the structure of the 2,2,3-trimethylbutane molecule from its infrared spectrum. Infrared spectroscopy of aliphatic alkanes, infrared spectra of 2,2,3-trimethylbutane, a structural isomer of molecular formula C7H16 How do you interpret the infrared absorption spectrum of 2,2,3-trimethylbutane How to interpret the infrared spectrum of 2,2,3-trimethylbutane Explanatory diagram of the infrared spectrum of the 2,2,3-trimethylbutane molecule in terms of its molecular structure. Listing data of the prominent main wavenumber peaks troughs in the infrared spectrum of 2,2,3-trimethylbutane. How to explain the infrared spectrum of 2,2,3-trimethylbutane. Use of the infrared spectrum of 2,2,3-trimethylbutane, identification of 2,2,3-trimethylbutane from its infrared spectrum - fingerprint wavenumber pattern to identify the 2,2,3-trimethylbutane molecule. The uses of the infrared spectrum of the 2,2,3-trimethylbutane molecule. The distinctive features of the infrared spectrum of the 2,2,3-trimethylbutane molecule explained interpretation diagram explaining the peaks-trough of the transmittance of the infrared spectrum of 2,2,3-trimethylbutane what does the infrared spectrum tell you about the structure and properties of the 2,2,3-trimethylbutane molecule? How is infrared spectrum of 2,2,3-trimethylbutane used to identify 2,2,3-trimethylbutane?
Links associated with 2,2,3-trimethylbutane
The mass spectrum of 2,2,3-trimethylbutane
The H-1 NMR spectrum of 2,2,3-trimethylbutane
The C-13 NMR spectrum of 2,2,3-trimethylbutane
The chemistry of ALKANES revision notes INDEX
All Advanced Organic Chemistry Notes
Email doc b: chem55555@hotmail.com
Website content © Dr Phil Brown 2000+. All copyrights reserved on revision notes, images, quizzes, worksheets etc. Copying of Doc Brown's pre-university advanced level chemistry website material is NOT permitted. Exam revision summaries & references to science course specifications are unofficial. These organic chemistry revision notes on spectroscopy are suitable for use of pre-university students studying AQA advanced level chemistry, Edexcel advanced level chemistry, OCR advanced level chemistry, IB advanced level chemistry, WJEC (Eduqas) advanced level chemistry, CIE advanced level chemistry, US grade 11-12 AP honors chemistry courses and they will also prove useful to 1st year undergraduate students of chemistry.
