Advanced Organic Chemistry: 1H NMR spectrum of 2,2,3-trimethylbutane (CH3)2CHC(CH3)3 HOME PAGE * SEARCH * GCSE Level Chemistry age ~14-16 * Advanced Level Chemistry age ~16-19
|
Interpreting the 1H NMR spectrum of 2,2,3-trimethylbutane [Author © Dr Phil Brown PhD: Doc Brown's advanced level organic chemistry exam revision notes suitable for students of UK A level chemistry courses & US K12 grade 11, grade 12 & AP honors chemistry courses: Molecular spectroscopy - analysing 1H NMR spectrum of 2,2,3-trimethylbutane [spectra updated Mar 19th 2026 *] Re-edit 1H NMR spectrum of (CH3)3CCH(CH3)2This is a BIG website, PLEASE take time to explore it Links associated with 2,2,3-trimethylbutane * [privacy, cookies & disclaimer policies] H-1 proton NMR spectroscopy - spectra index See also comparing the 1H NMR and 13C NMR spectra of the nine alkane structural isomers of C7H16 Introductory note on the 1H NMR spectra of 2,2,3-trimethylbutane
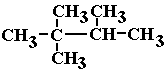
2,2,3-trimethylbutane C7H16
For more see The molecular structure, classification and naming of alkanes
Key points about the 1H NMR spectrum of 2,2,3-trimethylbutane and a practice question
|
|||||||||||||||||||||||||||||||||||||||||||||||||||||||||||||||||||||||||||||||||||||||||||||||||||||||||||||||||||||||||||||||||||||||||||||||||||||||||||||||||||||||||||||||||||||||||||||||||||||||||
| Chemical Shift (δ, ppm) | Proton Type | Environment | Integration | Multiplicity | Notes |
|---|---|---|---|---|---|
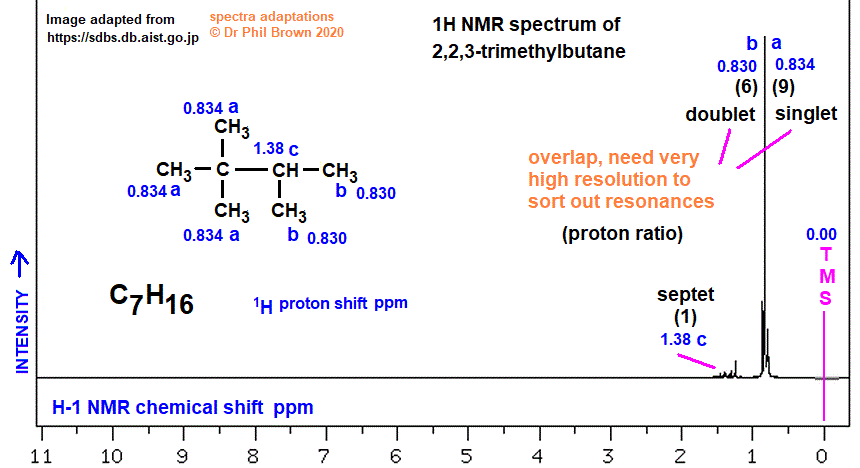
| ~0.88, 0.834 ppm | CH3 (3× methyl) | Attached to C2 (tertiary carbon) | 9H | Singlet | Equivalent due to symmetry |
| ~0.93, 0.830 ppm | CH3 (2× methyl) | Attached to C3 (secondary carbon) | 6H | Singlet | Slightly different environment |
| ~1.50, 1.38 ppm | CH (methine) | Central CH at C3 | 1H | Singlet | No neighboring protons |
Total protons = 9 + 6 + 1 = 16
Three signals due to distinct environments: tertiary methyls, secondary methyls, and one methine protonSource: https://sdbs.db.aist.go.jp/ diagram 1H δ ppm spectral database of organic compounds
Common Misconceptions
| Misconception | Clarification |
|---|---|
| "All methyl groups give the same signal" | Only if they’re in identical environments — here, C2 and C3 methyls differ |
| "Symmetrical molecules give one peak" | Partial symmetry can still yield multiple environments |
| "Multiplicity always means splitting" | Singlets occur when protons have no neighbours (n = 0) |
| "Integration is always 1:1" | Integration reflects number of protons in each environment — not equal unless structure dictates it |
Exam Revision Tips
- Count environments, not atoms: Use symmetry and bonding to identify equivalent protons.
- Use integration ratios: 9:6:1 is diagnostic for this molecule.
- Multiplicity = n+1 rule: Only applies when neighboring protons exist — here, all signals are singlets.
- Chemical shift clues: Alkyl protons appear between ~0.8–1.5 ppm.
- Compare with isomers: Isomers like 3-methylhexane show more signals and splitting.
Tips for spotting equivalent methyl group protons in 1H NMR
- Check for identical attachments: If two or more methyl groups are bonded to the same carbon and that carbon is not chiral, they are usually equivalent.
- Look for symmetry: Even partial symmetry can lead to equivalence.
- Use integration clues: If two methyl groups give a single peak with integration of 6H (3 gives 9H), that's a strong hint they are equivalent.
- Compare with isomers: Try contrasting 2,2,3-trimethylbutane with 2,2-dimethylpentane with 3-methylhexane, where methyl proton environments differ more clearly.
- Counting methyls as separate signals: Leads to overestimating the number of peaks in ¹H NMR spectra.
- Assuming all methyls are equivalent: Not true in asymmetric or chiral environments.
- Ignoring branching effects: Branching can create or remove equivalence depending on the substitution pattern.
Practice Question
Q:
The ¹H NMR spectrum of a hydrocarbon shows three singlets: one at δ =
0.88 ppm integrating to 9 protons, one at δ = 0.93 ppm integrating to 6
protons, and one at δ = 1.50 ppm integrating to 1 proton.
Which of the following is the most likely identity of the compound?
- Heptane
- 2,2,3-Trimethylbutane
- 3-Methylhexane
- Cycloheptane
Model Answer
Correct answer: B. 2,2,3-Trimethylbutane
Justification:
- Three singlets → indicates no splitting and distinct environments
- Integration 9:6:1 → matches three methyls on C2, two methyls on C3, and one methine proton
- Chemical shifts → consistent with alkyl protons
- Other options would show more signals and splitting due to less symmetry and more varied environments
The splitting pattern from proton spin-spin coupling effects is analysed using the n+1 rule for adjacent non-equivalent proton fields (n is the number of neighbouring protons in a non-equivalent different chemical environment).
| Number of directly adjacent protons 1H causing splitting | Splitting pattern produced from the n+1 rule on spin-spin coupling and the theoretical ratio of line intensities | ||||||||||||
| 0 means no splitting | 1 | ||||||||||||
| 1 creates a doublet | 1 | 1 | |||||||||||
| 2 creates a triplet | 1 | 2 | 1 | ||||||||||
| 3 creates a quartet | 1 | 3 | 3 | 1 | |||||||||
| 4 creates a quintet | 1 | 4 | 6 | 4 | 1 | ||||||||
| 5 creates a sextet | 1 | 5 | 10 | 10 | 5 | 1 | |||||||
| 6 creates a septet | 1 | 6 | 15 | 20 | 15 | 6 | 1 | ||||||
|
Comparing the 1H NMR and 13C NMR spectra of the nine alkane structural isomers of C7H16 You can distinguish all 9 isomers from a data combination of their number of 1H NMR chemical shifts, and their resulting integrated 1H proton ratios, plus, their number of 13C chemical shifts. |
||||
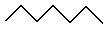
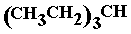
| Name of the alkane structural isomer of molecular formula C7H16 | Abbreviated structural formulae of the nine isomers of molecular formula C7H16 (interpretation complications with 3-methylhexane and 2,3-dimethylpentane because they exhibit R/S isomerism due to a chiral carbon) | Skeletal formula of the nine alkane isomers of molecular formula C7H16 | Number of 1H NMR chemical shifts (δ) and proton ratio (links to spectrum) | Number of 13C chemical shifts (δ) (links to spectrum) |
| heptane |
 |
 |
4 δ: proton ratio: 3:2:2:1 (6:4:4:2 in the molecule) | 4 δ shifts |
| 2-methylhexane |
 |
 |
6 δ: proton ratio : 6:3:2:2:2:1 | 6 δ shifts |
| 3-methylhexane |
 |
 |
7 δ: proton ratio: 3:3:3:2:2:2:1 (simplification) ! | 7 δ shifts |
| 3-ethylpentane |
 |
 |
3 δ: proton ratio: 9:6:1 | 3 δ shifts |
| 2,2-dimethylpentane |
 |
 |
4 δ: proton ratio: 9:3:2:2 | 5 δ shifts |
| 2,3-dimethylpentane |
 |
 |
6 δ: proton ratio: 6:3:3:2:1:1 (simplification) ! | 6 δ shifts (simplification) !!! |
| 2,4-dimethylpentane |
 |
 |
3 δ: proton ratio: 12:2:2 | 3 δ shifts |
| 3,3-dimethylpentane |
 |
 |
3 δ: proton ratio: 3:3:2 (6:4:4 in the molecule) | 4 δ shifts |
| 2,2,3-trimethylbutane |
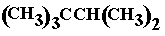 |
 |
3 δ: proton ratio: 9:6:1 | 4 δ shifts |
Key words & phrases: C7H16 Interpreting the proton H-1 NMR spectra of 2,2,3-trimethylbutane, low resolution & high resolution proton nmr spectra of 2,2,3-trimethylbutane, H-1 nmr spectrum of 2,2,3-trimethylbutane, understanding the hydrogen-1 nmr spectrum of 2,2,3-trimethylbutane, explaining the line splitting patterns in the high resolution H-1 nmr spectra of 2,2,3-trimethylbutane, revising the H-1 nmr spectrum of 2,2,3-trimethylbutane, proton nmr of 2,2,3-trimethylbutane, ppm chemical shifts of the H-1 nmr spectrum of 2,2,3-trimethylbutane, explaining and analyzing spin spin line splitting in the H-1 nmr spectrum, how to construct the diagram of the H-1 nmr spectrum of 2,2,3-trimethylbutane, how to work out the number of chemically different protons in the structure of the 2,2,3-trimethylbutane organic molecule, how to analyse the chemical shifts in the hydrogen-1 H-1 proton NMR spectrum of 2,2,3-trimethylbutane using the n+1 rule to explain the spin - spin coupling ine splitting in the proton nmr spectrum of 2,2,3-trimethylbutane deducing the nature of the protons from the chemical shifts ppm in the H-1 nmr spectrum of 2,2,3-trimethylbutane examining the 1H nmr spectrum of 2,2,3-trimethylbutane analysing the 1-H nmr spectrum of 2,2,3-trimethylbutane how do you sketch and interpret the H-1 NMR spectrum of 2,2,3-trimethylbutane interpreting interpretation of the 1H proton NMR spectrum of 2,2,3-trimethylbutane (CH3)3CCH(CH3)2 (H3C)3CCH(CH3)2 Molecular structure diagram of the proton NMR diagram for the 1H NMR spectrum of 2,2,3-trimethylbutane. The proton ratio in the 1H NMR spectrum of 2,2,3-trimethylbutane. Deducing the number of different chemical environments of the protons in the 2,2,3-trimethylbutane molecule from the 1H chemical shifts in the hydrogen-1 NMR spectrum of 2,2,3-trimethylbutane. Analysing the high resolution 1H NMR spectrum of 2,2,3-trimethylbutane. Analysing the low resolution 1H NMR spectrum of 2,2,3-trimethylbutane. You may need to know the relative molecular mass of 2,2,3-trimethylbutane to deduce the molecular formula from the proton ratio of the 1H NMR spectrum of 2,2,3-trimethylbutane. Revision notes on the proton NMR spectrum of 2,2,3-trimethylbutane. Matching and deducing the structure of the 2,2,3-trimethylbutane molecule from its hydrogen-1 NMR spectrum. Proton NMR spectroscopy of aliphatic alkanes, 1H NMR spectra of 2,2,3-trimethylbutane, a structural isomer of molecular formula C7H16 How do you interpret the H-1 NMR spectrum of 2,2,3-trimethylbutane How to interpret the H-1 NMR spectrum of 2,2,3-trimethylbutane Explanatory diagram of the chemical shifts of the 1H H-1 proton NMR spectrum of the 2,2,3-trimethylbutane molecule in terms of its molecular structure. Listing data of all the chemical shift peaks in ppm in the proton NMR spectrum of 2,2,3-trimethylbutane. How to explain the H-1 NMR spectrum of 2,2,3-trimethylbutane. The chemical shifts and integrated values of the proton ratios in the 1-H NMR spectrum of the 2,2,3-trimethylbutane molecule. How to work out the molecular structure of the 2,2,3-trimethylbutane molecule from its proton NMR spectrum. The uses and distinctive features of the proton NMR spectrum of the 2,2,3-trimethylbutane molecule explained. What does the H-1 proton NMR spectrum chemical shifts tell us about the structure and properties of the 2,2,3-trimethylbutane molecule? explaining the spin-spin proton coupling effects in the 1H NMR spectrum of 2,2,3-trimethylbutane. interpretation diagram explaining the proton splitting pattern produced from the n+1 rule and the theoretical ratio of chemical shift and values of intensities for the proton NMR spectrum lines of 2,2,3-trimethylbutane
Links associated with 2,2,3-trimethylbutane
The infrared spectrum of 2,2,3-trimethylbutane
The mass spectrum of 2,2,3-trimethylbutane
The C-13 NMR spectrum of 2,2,3-trimethylbutane
The chemistry of ALKANES revision notes INDEX
H-1 proton NMR spectroscopy index (Please read 8 points at the top of the 1H NMR index page)
All Advanced Organic Chemistry Notes
Email doc b: chem55555@hotmail.com
Website content © Dr Phil Brown 2000+. All copyrights reserved on revision notes, images, quizzes, worksheets etc. Copying of Doc Brown's pre-university advanced level chemistry website material is NOT permitted. Exam revision summaries & references to science course specifications are unofficial. These organic chemistry revision notes on spectroscopy are suitable for use of pre-university students studying AQA advanced level chemistry, Edexcel advanced level chemistry, OCR advanced level chemistry, IB advanced level chemistry, WJEC (Eduqas) advanced level chemistry, CIE advanced level chemistry, US grade 11-12 AP honors chemistry courses and they will also prove useful to 1st year undergraduate students of chemistry.
