|
Interpreting the
1H NMR spectrum of 3-ethylpentane
[Author
©
Dr WP Brown PhD:
Doc Brown's advanced level organic chemistry exam revision notes
suitable for students of UK A level chemistry courses & US K12 grade
11, grade 12 and AP honors chemistry courses: Molecular
spectroscopy - analysing the
1H NMR spectrum of
2-ethylpentane
[updated
October 24th 2025]
email doc
brown
Re-edit
HC(CH2CH3)3
The chemistry of ALKANES and the petrochemical
industry
Links associated with 3-ethylpentane
This is a BIG
website, PLEASE take time to explore it
H-1 proton NMR spectroscopy -
spectra index
See also
comparing the
1H NMR and 13C NMR spectra of the nine alkane structural isomers of C7H16
Introductory note on the 1H NMR spectra of 3-ethylpentane
Students and teachers please note my explanation of the
proton NMR spectrum of 3-ethylpentane is designed for advanced, but
pre-university, chemistry courses.
The chemical shift
δ splitting pattern effects for
3-ethylpentane are
confined to a proton spin-spin
coupling effects analysed using the n+1 rule for adjacent
non-equivalent proton fields (n is the number of neighbouring
protons in a non-equivalent different chemical environment for the
3-ethylpentane molecule).
It is assumed that the integrated intensities of the
1H
NMR δ
chemical shifts give the ratio of the protons in the different
non-equivalent chemical environments of the 3-ethylpentane molecule.
The most common solvent used for investigating the 1H NMR
spectrum of compounds like 3-ethylpentane, is CDCl3 and other
deuterated solvents to avoid confusion with a 1H NMR
signal, 2D (2H) has a different NMR chemical
shift.

TMS is the acronym for tetramethylsilane, formula Si(CH3)4,
whose protons are arbitrarily given a chemical shift of 0.0 ppm.
This is the 'standard' in 1H NMR spectroscopy and all
other proton resonances, called chemical shifts, are measured
with respect to the TMS, and depend on the
individual (electronic) chemical environment of the hydrogen atoms
in an organic molecule - 3-ethylpentane here.
In terms of spin-spin coupling from the possible proton magnetic orientations,
for 3-ethylpentane I
have only considered the interactions of
non-equivalent protons on adjacent carbon atoms
e.g. -CH2-CH3
or >CH-CH3
or R-CH2-CH2-X
protons etc.
The chemical shifts quoted in ppm on the diagram of
the H-1 NMR spectrum of 3-ethylpentane represent the peaks of the intensity of
the chemical shifts of (which are often groups of split lines at
high resolution) AND the relative integrated areas under the peaks
gives you the ratio of protons in the different chemical
environments of the 3-ethylpentane molecule.
3-ethylpentane
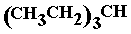
CH(CH2CH3)3


For more
see
The molecular structure,
classification and
naming of alkanes
Interpreting the
H-1 NMR spectrum of
3-ethylpentane
For relatively simple molecules, the low
resolution H-1 NMR spectrum of 3-ethylpentane is a good starting point
(lower and higher resolution diagrams above).
The hydrogen atoms (protons) of 3-ethylpentane occupy
3
different chemical environments so that the low resolution NMR
spectra should show 3 principal peaks of different H-1 NMR chemical shifts (diagram above for
3-ethylpentane).
(CH3CH2)3CH
Note the proton ratio 9:6:1 of the 3 colours of the protons
in the 3 chemically different environments
Chemical shifts
(a) to (c) on the H-1 NMR
spectrum diagram for 3-ethylpentane.
Although there are 16 hydrogen atoms in the molecule,
there are only 3 possible different chemical
environments for the hydrogen atoms in 3-ethylpentane molecule.
The integrated signal proton ratio 9:6:1 observed
in the high resolution H-1 NMR spectrum, corresponds with
the structural formula of 3-ethylpentane.
The high resolution 1H NMR
spectrum of 3-ethylpentane
All low and high resolution spectra of
3-ethylpentane
show 3 groups of proton resonances and in the 9:6:1 ratio expected from the
formula of 3-ethylpentane.
The ppm quoted on the diagram represent the peak
of resonance intensity for a particular proton group in the
molecule of 3-ethylpentane - since the peak' is at the apex of a band of
H-1 NMR resonances due to spin - spin coupling field splitting effects - see high resolution
notes on 3-ethylpentane below.
So, using the chemical shifts and applying the
n+1 rule to
3-ethylpentane
and make some predictions using some colour coding! (In problem
solving you work the other way round!)
(a) 1H
Chemical shift 0.84 ppm, CH3 protons:(CH3CH2)3CH
This 1H resonance is split into a 1:2:1
triplet by the adjacent CH2 protons (n+1 = 3)
All nine of
the -CH3 group protons are chemically equivalent to each
other, so give the same H-1 NMR shift of 0.84 ppm because they
occupy identical chemical environments.
Evidence for the presence of a CH2 group
in the molecule of 3-ethylpentane.
(b) 1H
Chemical shift 1.28 CH2 protons:(CH3CH2)3CH
This 1H resonance is split into a
1:4:6:4:1 quintet by adjacent CH3 and CH
protons on either side (n+1 = 5)
All six of
the -CH2- group protons are chemically equivalent to each
other, so give the same H-1 NMR shift of 1.28 ppm because they
occupy identical chemical environments.
Evidence for the presence of a CH3-C-CH grouping
in the molecule of 3-ethylpentane.
(c) 1H
Chemical shift 1.09 ppm, CH protons:(CH3CH2)3CH
This 1H resonance is split into a septet
by three lots of adjacent CH2 protons (n+1 =
7)
The only unique H-1 chemical environment is the
proton of the >CH- grouping, so has a different H-13 NMR
chemical shift of 1.09 ppm.
Key points about the 1H
NMR spectrum of 2-ethylpentane
chemical shifts for the ¹H
NMR Spectrum of 2-Ethylpentane
Despite having seven carbon atoms and sixteen protons,
2-ethylpentane exhibits only three distinct proton
environments in its ¹H NMR spectrum due to
molecular symmetry.
The three ethyl groups (–CH2CH 3)
are chemically equivalent, simplifying the spectrum.
| Chemical Shift
(δ, ppm) |
Integration |
Multiplicity |
Proton Type |
Environment |
| ~0.9 ppm, 0.84 ppm |
9H |
Septet |
CH3 |
Three equivalent terminal
methyl groups |
| ~1.2–1.4 ppm, 1.28
ppm |
6H |
Quintet |
CH2 |
Three equivalent methylene
groups (CH2CH3) |
| ~1.4–1.6 ppm, 1.09
ppm |
1H |
Multiplet |
CH |
Central methine proton
(CH–CH2CH3) |
https://sdbs.db.aist.go.jp/
diagram δ ppm spectral database of organic
compounds
Why Only 3
Signals?
- The molecule has three identical ethyl groups
(-CH2CH3) attached to a central CH.
- All CH3 groups are equivalent → 1
signal (triplet).
- All CH2 groups are equivalent → 1
signal (sextet due to coupling with CH3 and CH).
- The central CH proton is unique → 1 signal
(multiplet due to coupling with six equivalent CH₂ protons).
Common
Misconceptions
- Expecting more than 3 peaks: Students often
overlook symmetry and count each hydrogen separately.
- Misassigning multiplicity: The CH3 protons
appear as a sextet (not quartet) due to coupling with both CH₃ (3H)
and CH (1H).
- Ignoring integration clues: The 9:6:1 ratio is
a strong hint toward three equivalent ethyl groups and one central
proton.
Exam Tips
- Look for symmetry: It drastically reduces the
number of signals.
- Use integration ratios: 9:6:1 is diagnostic for
three ethyl groups around a central CH.
- Apply the n+1 rule carefully: Consider all
neighboring protons, not just the obvious ones.
- Compare with isomers: 3-methylhexane or
n-heptane would show more signals due to less symmetry.
The splitting pattern from proton
spin-spin coupling effects is analysed using the n+1 rule for
adjacent non-equivalent proton fields (n is the number of
neighbouring protons in a non-equivalent different chemical
environment) and applied to the 1H NMR spectrum of
3-ethylpentane.
|
Number of directly adjacent protons 1H
causing splitting |
Splitting pattern produced from the
n+1 rule on spin-spin coupling and the theoretical ratio of line intensities |
|
0
means no splitting |
|
|
|
|
|
|
1 |
|
|
|
|
|
|
|
1
creates a doublet |
|
|
|
|
|
1 |
|
1 |
|
|
|
|
|
|
2
creates a triplet |
|
|
|
|
1 |
|
2 |
|
1 |
|
|
|
|
|
3
creates a quartet |
|
|
|
1 |
|
3 |
|
3 |
|
1 |
|
|
|
|
4
creates a quintet |
|
|
1 |
|
4 |
|
6 |
|
4 |
|
1 |
|
|
|
5
creates a sextet |
|
1 |
|
5 |
|
10 |
|
10 |
|
5 |
|
1 |
|
|
6
creates a septet |
1 |
|
6 |
|
15 |
|
20 |
|
15 |
|
6 |
|
1 |
|
Comparing the
1H NMR and 13C NMR spectra of the nine alkane structural isomers of C7H16
You can distinguish all 9 isomers from a data combination of their number of
1H NMR
chemical shifts,
and their resulting integrated 1H proton ratios, plus, their number of
13C
chemical shifts. |
|
Name of the alkane structural isomer of molecular
formula C7H16 |
Abbreviated structural formulae
of the nine isomers of molecular formula C7H16 (interpretation complications with 3-methylhexane and
2,3-dimethylpentane because they exhibit R/S isomerism due to a
chiral carbon) |
Skeletal formula of the
nine
alkane isomers of
molecular formula C7H16 |
Number of 1H NMR chemical shifts (δ) and
proton ratio (links
to spectrum) |
Number of 13C chemical shifts (δ)
(links
to spectrum) |
|
heptane |
 |
 |
4 δ: proton ratio: 3:2:2:1 (6:4:4:2 in the molecule) |
4 δ shifts |
|
2-methylhexane |
 |
 |
6 δ: proton ratio :
6:3:2:2:2:1 |
6 δ shifts |
|
3-methylhexane |
 |
 |
7 δ: proton ratio:
3:3:3:2:2:2:1 (simplification) ! |
7
δ shifts |
|
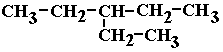
3-ethylpentane |
|
|
3 δ: proton ratio:
9:6:1 |
3 δ
shifts |
|
2,2-dimethylpentane |
 |
 |
4 δ: proton ratio:
9:3:2:2 |
5 δ shifts |
|
2,3-dimethylpentane |
 |
 |
6 δ: proton ratio:
6:3:3:2:1:1 (simplification) ! |
6 δ
shifts (simplification) !!! |
|
2,4-dimethylpentane |
 |
 |
3 δ: proton ratio:
12:2:2 |
3 δ
shifts |
|
3,3-dimethylpentane |
 |
 |
3 δ: proton ratio:
3:3:2 (6:4:4 in the molecule) |
4 δ
shifts |
|
2,2,3-trimethylbutane |
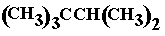 |
 |
3 δ: proton ratio:
9:6:1 |
4 δ shifts |
Key words & phrases:C7H16
Interpreting the proton H-1 NMR spectra of 3-ethylpentane, low resolution & high resolution proton
nmr spectra of 3-ethylpentane, H-1 nmr spectrum of 3-ethylpentane, understanding the
hydrogen-1 nmr spectrum of 3-ethylpentane, explaining the line splitting patterns in the
high resolution H-1 nmr spectra of 3-ethylpentane, revising the H-1 nmr spectrum of
3-ethylpentane,
proton nmr of 3-ethylpentane, ppm chemical shifts of the H-1 nmr spectrum of
3-ethylpentane,
explaining and analyzing spin spin line splitting in the H-1 nmr spectrum, how
to construct the diagram of the H-1 nmr spectrum of 3-ethylpentane, how to work out the
number of chemically different protons in the structure of the 3-ethylpentane organic
molecule, how to analyse the chemical shifts in the hydrogen-1 H-1 proton NMR
spectrum of 3-ethylpentane using the n+1 rule to explain the spin - spin coupling ine
splitting in the proton nmr spectrum of 3-ethylpentane deducing the nature of the protons
from the chemical shifts ppm in the H-1 nmr spectrum of 3-ethylpentane
examining the 1H nmr spectrum of 3-ethylpentane analysing the 1-H nmr spectrum of
3-ethylpentane how do you sketch and interpret the H-1 NMR spectrum of
3-ethylpentane interpreting interpretation of the 1H proton NMR spectrum of
3-ethylpentane
(CH3CH2)3CH CH3CH2CH(CH2CH3)CH2CH3
Molecular structure diagram of the
proton NMR diagram for the 1H NMR spectrum of 3-ethylpentane. The proton ratio in the
1H NMR spectrum of 3-ethylpentane. Deducing the number of different chemical
environments of the protons in the 3-ethylpentane molecule from the 1H chemical shifts
in the hydrogen-1 NMR spectrum of 3-ethylpentane. Analysing the high resolution 1H NMR
spectrum of 3-ethylpentane. Analysing the low resolution 1H NMR spectrum of
3-ethylpentane. You
may need to know the relative molecular mass of 3-ethylpentane to deduce the molecular
formula from the proton ratio of the 1H NMR spectrum of 3-ethylpentane. Revision notes
on the proton NMR spectrum of 3-ethylpentane. Matching and deducing the structure of
the 3-ethylpentane molecule from its hydrogen-1 NMR spectrum.
Proton NMR spectroscopy of aliphatic alkanes,
1H NMR spectra of 3-ethylpentane, a structural isomer of molecular formula
C7H16
How do you interpret the H-1 NMR spectrum of
3-ethylpentane How to interpret
the H-1 NMR spectrum of 3-ethylpentane Explanatory diagram of the chemical
shifts of the 1H H-1 proton NMR spectrum of the 3-ethylpentane
molecule in terms of its molecular structure. Listing data of all the chemical shift peaks in ppm in the
proton NMR spectrum of 3-ethylpentane. How to explain the H-1 NMR spectrum of
3-ethylpentane. The chemical shifts and integrated values of the proton ratios in the 1-H NMR
spectrum of the 3-ethylpentane molecule. How to work out the molecular
structure of the 3-ethylpentane molecule from its proton NMR spectrum. The uses
and distinctive features of the proton NMR spectrum of the
3-ethylpentane
molecule explained. What does the H-1 proton NMR spectrum chemical
shifts tell us about the
structure and properties of the 3-ethylpentane
molecule? explaining the spin-spin proton coupling effects in the 1H
NMR spectrum of 3-ethylpentane.
diagram explaining the proton splitting
pattern produced from the n+1 rule and the theoretical ratio of chemical shift
and values of intensities for the proton NMR spectrum lines of 3-ethylpentane
Links associated
with
3-ethylpentane
The infrared spectrum of
3-ethylpentane
The mass spectrum of
3-ethylpentane
The
C-13 NMR spectrum of 3-ethylpentane
The chemistry of ALKANES
revision notes INDEX
H-1 proton NMR spectroscopy index
(Please
read 8 points at the top of the 1H NMR index page)
ALL SPECTROSCOPY INDEXES
All Advanced Organic
Chemistry Notes
Use My Google search site box
Email doc b:
chem55555@hotmail.com
TOP OF PAGE
|
Infrared spectra of the isomers of C7H16
The infrared
spectrum of heptane
The
infrared spectrum of 2-methylhexane
The
infrared spectrum of 3-methylhexane
The
infrared spectrum of 3-ethylpentane
The infrared spectrum of
2,2-dimethylpentane
The infrared spectrum of
2,3-dimethylpentane
The infrared spectrum of
2,4-dimethylpentane
The infrared spectrum of
3,3-dimethylpentane
The infrared spectrum
of 2,2,3-trimethylbutane
|
Mass spectra of the isomers of C7H16
The mass
spectrum of heptane
The mass
spectrum of 2-methylhexane
The mass
spectrum of 3-methylhexane
The
mass spectrum of 3-ethylpentane
The mass spectrum of
2,2-dimethylpentane
The mass spectrum of
2,3-dimethylpentane
The mass spectrum of
2,4-dimethylpentane
The mass spectrum of
3,3-dimethylpentane
The mass
spectrum of 2,2,3-trimethylbutane
|
|
H-1 proton NMR spectra of ALKANES
1H NMR spectra of the isomers of C7H16
The H-1 NMR
spectrum of heptane
The
H-1 NMR spectrum of 2-methylhexane
The
H-1 NMR spectrum of 3-methylhexane
The
H-1 NMR spectrum of 3-ethylpentane
The H-1 NMR spectrum of
2,2-dimethylpentane
The H-1 NMR spectrum of
2,3-dimethylpentane
The H-1 NMR spectrum of
2,4-dimethylpentane
The H-1 NMR spectrum of
3,3-dimethylpentane
The H-1
NMR spectrum of 2,2,3-trimethylbutane
|
C-13 carbon-13 NMR spectra
of ALKANES
13C NMR spectra of the isomers of C7H16
The C-13 NMR
spectrum of heptane
The
C-13 NMR spectrum of 2-methylhexane
The
C-13 NMR spectrum of 3-methylhexane
The
C-13 NMR spectrum of 3-ethylpentane
The C-13 NMR spectrum of
2,2-dimethylpentane
The C-13 NMR spectrum of
2,3-dimethylpentane
The C-13 NMR spectrum of
2,4-dimethylpentane
The C-13 NMR spectrum of
3,3-dimethylpentane
The
C-13 NMR spectrum of 2,2,3-trimethylbutane
|
Website content © Dr
Phil Brown 2000+. All copyrights reserved on revision notes, images,
quizzes, worksheets etc. Copying of Doc Brown's pre-university
advanced level chemistry website material is NOT
permitted. Exam revision summaries & references to science course specifications
are unofficial. These organic chemistry revision notes on
spectroscopy are
suitable for use of pre-university students studying AQA advanced level
chemistry, Edexcel advanced level chemistry, OCR advanced level
chemistry, IB advanced level chemistry, WJEC (Eduqas) advanced level
chemistry, CIE advanced level chemistry, US grade 11-12 AP honors
chemistry courses and they will also prove useful to
1st year undergraduate students of chemistry.
|
